


Arsenal FC - 2024/25 Financial Estimates
P&L, Investment, CF, and Debt

Arsenal’s 2024/25 financial year ended on 31 May 2025, encompassing a period when the (i) men’s club finished second in the Premier League (PL) and reached the UEFA Champions League (UCL) semifinals and (ii) women’s club (AWFC) finished second in the Women’s Super League (WSL) and won the UEFA Women’s Champions League (UWCL), representing AWFC’s second continental title.
With the financial period concluded, this post will provide initial estimates for Arsenal’s 2024/25 financials across the following dimensions:
Profit and loss account statement
Fixed asset investment (player and infrastructure)
Cash flow statement
Financial debt and transfer debt
The format for each section will generally entail a summary figure followed by the rationale for each key line item.
Housekeeping Notes
The interchangeable references to Arsenal FC, Arsenal, and AFC in this post refer to Arsenal Holdings Limited, a UK-incorporated holding company that indirectly owns 100% of share capital of (i) the men’s and women’s football clubs (each highlighted in blue) and (ii) legal entities that engage in modest property development activities.

More importantly, as for any entry providing estimates and/or projections, the standard disclaimer applies that figures are (i) subject to revision as new information becomes available and (ii) developed based on judgments and assumptions, and therefore will vary (potentially significantly) from actual figures. The objective of this exercise is to provide a reasonably accurate directional view of financials based on information available.
Section 1: Profit & Loss Statement Estimates
Key P&L estimates are summarized below, with each metric expected to improve versus 2023/24:
Revenue of £674.6m; year-over-year (YOY): +£61.0m (9.9%)
Adjusted EBITDA of £165.0m; YOY: +£25.5m (18.3%)
Adjusted EBIT a loss of £36.0m; YOY loss narrowing by £13.7m (27.6%)
Pre-tax profit of £17.1m; positive YOY swing of £34.8m

Broadcast Revenue: Premier League Component
Arsenal received PL distributions of £175.5m for 2023/24 per the PL Annual Report published in Feb ’25.
I estimate AFC’s PL-derived distributions increased YOY by £1.7m (1.0%) to £177.2m attributable to estimated growth for international and central payout pools (AFC impact: +£3.4m), partially offset by appearing two fewer times on domestic live TV (AFC impact: -£1.7m).

Broadcast Revenue: UEFA Component
Arsenal generated revenue of €94.0m (~ £80.9m) for reaching the UCL quarterfinals in 2023/24 per UEFA’s annual financial report.
I estimate UEFA-linked revenue increased YOY by €25.9m (27.5%) to €119.9m, reflecting an estimated (post-translation) £19.3m increase attributable to (i) deeper advancement (semifinals) and (ii) the increased payout pool for the 2024-2027 cycle.

Broadcast Revenue: Total
Aggregating estimated YOY changes for PL-derived income (+1.7m) and UEFA-derived income (+£19.3m) results in a projected broadcast revenue increase of £21.0m (8.0%) to £283.3m (note: ancillary broadcast revenue elements modeled as unchanged YOY).

Commercial Revenue
Arsenal generated commercial revenue of £219.6m in 2023/24, representing a £48.9m YOY improvement driven by (i) the upsized Emirates contract, (ii) the new training centre naming rights deal with Sobha Realty announced in Feb ‘24, (iii) increased breadth of secondary partnerships through several new deals (including, but not limited to, Google Pixel, Persil, Betway, and Hotels.com), (iv) improved retail/merchandising revenue, and (v) increased pre-season tour income.
To estimate YOY changes for 2024/25 I considered factors that include, but aren’t limited to:
Full period impact from the elevation of Sobha Realty to a principal partner (versus ~ one-third of period in 2023/24).
Further expansion of secondary partnerships through new deals with Athletic Brewing Co, Chivas Regal, ComAve, and NTT Data announced relatively early in the period.
Likely YOY improvement to retail and merchandising revenue, albeit with improvement expected to be lower in magnitude compared the jump from 2022/23 to 2023/24.
Note: Per UEFA European Club Finance and Investment Landscape (ECFIL) reports, merchandising revenue increased from €89m in 2022/23 (~ £77.4m at GBP:EUR used in the Feb ’24 report) to €120m in 2023/24 (~ £103.2m at GBP:EUR used in the Feb ’25 report).
The pre-season tour in summer 2024 was indicatively similar in scale and breadth to the summer 2023 tour.
There were no concerts staged at Emirates Stadium in 2024/25 after four were staged during the prior period.
Based on the mosaic above (and other considered factors), I estimate a YOY increase of £21.6m (9.8%) to £241.3m, with the note/concession that I might be materially understating uplift from secondary partnership expansion and retail operations.

Matchday Revenue
Arsenal generated matchday revenue of £131.7m in 2023/24, a period when 25 men’s fixtures (PL: 19; UCL: 5; FA Cup: 1) and 6 women’s fixtures (all WSL) were staged at Emirates Stadium.
For 2024/25, I estimate a YOY increase of £18.3m (13.9%) to £150.0m, primarily driven by the factors cited below.
The number of men’s home fixtures increased by 5 (UCL: +2; EFL Cup: +3) and women’s fixtures at Emirates Stadium increased by 7 (WSL: +3; UWCL: +4).
The club increased prices for season tickets and match-by-match tickets by 6% in the lower tier and 4% in the upper tier.

Total Revenue
Aggregating each segment yields total estimated revenue of £674.6m, reflecting an estimated YOY increase of £61.0m (9.9%) and new club record (note: in aggregate and for each core segment).

Wage Expense
As I noted in my recent Liverpool entry, estimating/projecting wages can be challenging given the general opacity around sporting contracts.
With that caveat put forth, I considered various (non-exhaustive) elements cited in the table below to estimate the YOY change to the club’s 2023/24 wage bill of £327.8m.

Based on the summary factors, I landed on an estimated YOY increase of £18.0m (5.5%) to £345.8m, primarily driven by full-year impact from key player contract modifications executed in 2023/24, non-playing staff wage growth (technical staff contract modifications; assumed professional staff growth), and incremental variable bonuses from deeper progression in the UCL.

Due to estimated YOY revenue growth exceeding estimated wage growth, the club’s recurring-wage-to-revenue ratio is estimated to decrease from (an-already-strong-by-industry-standards) 53.4% to 51.3%.

Other Operating Expenses
Arsenal’s other operating expenses (OOEs) were £146.2m in 2023/24, which included, but were not limited to, costs related to staging matches, merchandising, maintenance, transportation, utilities, and insurance.
For the 2024/25 estimate, I considered elements that include (but aren’t limited to):
The club staged more events at Emirates Stadium on net in 2024/25 (men’s home: +5; women’s home: +7; concerts: -4).
Assumed growth for merchandising revenue likely entails incremental associated costs.
Per the UK’s Office for National Statistics (ONS), the Consumer Price Index (CPI) rose by 3.4% for the 12 months to May ’25.
I estimate a YOY increase of £17.5m (12.0%) to £163.7m based on factors above, with the impact from events staged at Emirates Stadium the most significant driver.

Due to estimated OOE growth exceeding estimated revenue growth on a relative basis, the club’s OOE-to-revenue ratio is estimated to edge up from 23.8% to 24.3%.

Adjusted EBITDA
Adjusted earnings before interest, tax, depreciation, and amortization (adj EBITDA) is generally viewed as a proxy for recurring cash profit. Note that adj EBITDA also excludes exceptional items and profit from fixed asset sales.
Based on derived estimates for revenue and recurring cash expenses, I estimate that AFC’s adj EBITDA continued impressive post-Covid-impact growth via a YOY increase by £25.5m (18.3%) to £165.0m (note: estimated margin from 22.7% to 24.5%).

Amortization Expense
Arsenal’s player amortization expense in 2023/24 was £171.1m, representing the write-down of transfer fees and other costs (e.g. agents’ fees and transfer levies) incurred to bring player registrations to their current condition.
For 2024/25, I estimate a YOY increase of £10.8m (6.3%) to £181.8m based on the modeled net impact from additions (+£24.1m), departures (-£5.9m), and contract modifications (-£7.5m).
Note that I haven’t provided schedules with estimated YOY amortization changes at individual player registration level, but an (indirect) example of the framework is provided in the forthcoming player sale profit discussion.

Depreciation Expense
Arsenal’s depreciation expense in 2023/24 was £18.3m (note: £18.2m net of capital grants). For 2024/25, I estimate a YOY increase of £1.0m to £19.3m (net: £19.2m) based on the impact from incremental capital costs.

Adjusted EBIT
Adjusted earnings before interest and taxes (adj EBIT), which like adj EBITDA excludes fixed asset sale profits and exceptional items, is generally viewed as a proxy for recurring day-to-day profit/(loss).
Based on derived estimates for adj EBITDA, amortization, and depreciation, I estimate adj EBIT of negative £36.0m for 2024/25, representing a YOY improvement of £13.7m.
Note that negative adj EBIT is the norm for football clubs, with 18 of 20 PL clubs (and all 17 non-relegated sides) posting a loss at this level for 2023/24 (median: loss of £59.2m).

Player Sale Profit
Profit from disposal of player registrations reflects net fees from sales less remaining book value at disposal.
With respect to net fees from sales in 2024/25, I estimate AFC generated £80.0m based on gross figures reported in media and cost assumptions for sales that entailed an intermediary payment(s) per the Football Association’s annual agent transactions report.

Among the transactions listed in the preceding figure, the registration for Aaron Ramsdale is likely the only one with meaningful remaining book value at sale.
Based on reported transaction details and assumptions for transaction costs and add-ons, the remaining book value estimate I obtain is £10.4m.

The resulting player sale profit estimate for the period is £69.6m (net fees from sales: £80.0m; remaining BV: £10.4m).

Net Finance Costs
Arsenal’s net finance costs were £18.4m in 2023/24 (costs: £18.8m; income: £0.3m), with net cash payments of £7.8m (payments: £8.1m; receipts: £0.3m).
Primarily driven by lower benchmark rates, I estimate a modest YOY decrease for both net costs and net cash payments:
Net cost decrease by £2.1m to £16.3m.
Net cash payment decrease by £1.5m to £6.3m.

Pre-Tax Profit/(Loss)
Based on (i) prior-discusses estimates for adj EBIT, player sale profit, and net finance costs and (ii) use of a 3-year historical average (2021-2024) for ancillary line items, I estimate a pre-tax profit of £17.1m for 2024/25, representing a swing of £34.8m from the pre-tax loss of £17.7m posted in 2023/24.

Section 2: Fixed Asset Investment Estimates
Net fixed asset investment by cost (note: not cash flow) for 2024/25 is estimated to be £32.6m, representing a YOY decrease of £172.8m (84.1%) and reflecting:
Net player spend of £19.4m; YOY: -£170.2m (-89.8%)
Net infrastructure spend of £13.2m; YOY: -£2.7m (-84.1%)

Player Net Spend
Recall that an estimate of £80.0m for net fees from sales was put forth in Section 1.
With respect to new player registration costs (i.e. gross spend), I estimate £99.4m for the period based on reported guaranteed transfer fees of £88.8m plus estimated transaction costs of £10.7m (note: modeled as 12.0% of the guaranteed fee).

Note that the resulting net spend estimate of £19.4m is calibrated to the following elements:
AFC disclosed a net spend of £20.9m in the note for subsequent events in 2023/24 accounts, encompassing the period from 01 Jun 2024 to 16 Oct 2024 (board approval of accounts; auditor sign-off).
Winter transfer window activity was limited to the sale of Ayden Heaven’s player registration (and potential modest income from Mika Biereth’s sell-on from Sturm Graz to Monaco).

The net player spend estimate of £19.4m is lower than actuals for each year across the past decade (and would entail lowest since £10.0m in 2012/13).

Tangible Asset Net Spend
I’m not aware of any major capital projects in progress, so I used AFC’s annual average tangible fixed asset spend across 2021-2024 to obtain the estimate of £13.2m for 2024/25.

Section 3: Cash Flow Estimates
Arsenal’s 2024/25 cash flow statement estimates are summarized below, which build from estimates in Sections 1 and 2:
Cash Flow from Operations (CFO) of £165.1m (-£3.1m; -1.8%), of £165.1m (-£3.1m; -1.8%), with the modest estimated YOY decrease driven by the assumption that working capital movements will be less beneficial in 2024/25.
Cash Flow from Investing (CFI) an outflow of £161.9m (lower outflow YOY by £44.2m / 22.4%), reflecting a net cash player spend estimate of £148.8m (2023/24: £193.4m) and net capital expenditure (capex) of £13.2m (2023/24: £12.7m).
Cash Flow from Financing (CFF) assumed to be nil, with the estimated £3.2m surplus from CFO + CFI funding a cash reserve increase from £66.8m to £70.0m.

Cash Flow from Operations
The CFO estimate of £165.1m closely aligns to estimated adj EBITDA of £165.0m (discussed in Section 1) based on an effective estimated offset from (i) net property income plus changes in net working capital and (ii) net finance payments.

Note that AFC’s CFO for 2023/24 of £168.2m was the strongest in the PL by some distance (next highest: THFC at £91.7m; PL median: £21.1m), and the estimate of £165.1m for 2024/25 implies an expectation that AFC will be among the highest (if not the highest) for the subject period as well.

NOTE: As a technical aside, I classify interest receipts and interest payments within operating activities. Therefore, CFO I present will vary from club-stated figures for those (such as Arsenal) that classify interest receipts within investment activities and interest payments within financing activities.
Cash Flow from Investing: Capital Expenditure
Arsenal’s capex outlay each year tends to closely track tangible fixed asset investment by cost, reflecting low impact from trade financing for this investment segment.

Based on this relationship, it is reasonable to align the capex estimate for 2024/25 to the tangible asset spend by cost estimate of £13.2m cited in Section 2.

Cash Flow from Investing: Player Registrations
While Arsenal’s cash outlay for infrastructure generally approximates cost, the relationship is materially different most years with respect to player registrations due to transfer installment impact.

Due to the historical lack of alignment between cost and cash spend for this segment, I developed the net cash player spend estimate based on the following assumptions:
Cash payments related to pre-2024/25 signings of £163.9m, equal to transfer installment payables due within 12-months as of end-2023/24 per club accounts.
Estimated cash payments of £34.8m for in-period activity, reflecting 35.0% of estimated gross spend cited in Section 2.
Cash receipts related to pre-2024/25 signings of £21.9m, equal to transfer installment receivables due within 12-months as of end-2023/24 per club accounts.
Estimated cash receipts of £28.0m for in-period activity, reflecting 35.0% of estimated net fees from sales cited in Section 2.
The resulting 2024/25 cash net player spend estimate is £148.8m (payments: £198.7m; receipts: £49.9m).

The difference between estimates for net cash player spend (£148.8m) and net spend by cost (£19.4m) is £129.3m, which implies a sizeable YOY decrease to net transfer debt (i.e. rebalancing after a period of growth) that will be covered in Section 4.

Cash Flow Excluding Financing
The estimates for CFO and CFI result in a cash-flow-excluding-financing estimate of +£3.2m for the period.

Cash Flow From Financing
As of end-May ‘24, Arsenal had (i) no usage on its committed revolving facility or (ii) non-revolving debt coming due within one year. Based on that outlay (and for general simplicity), I assume the estimated CFO + CFI surplus funded a modest increase to the club’s cash position.

Section 4: Debt Estimates
This section provides estimates for (i) financial debt and liquidity, (ii) transfer debt, and (iii) football net debt.
Financial Debt and Liquidity
For gross financial debt as of end-May ‘24, I assume (i) the owner loan balance remained static and, in line with trends from 2021-2024, (ii) long-term debentures increased by £0.5m.
Based on assumptions for gross debt and (from Section 3) changes in cash, I estimate:
Gross financial debt increased by £0.5m to £342.3m (note: external debt increase by £0.5m to £18.2m).
Net financial debt decreased by £2.7m to £272.2m (note: net cash surplus increase by £2.7m to £51.8m versus external debt).
Liquidity on hand, measured as cash reserves plus unused on committed facilities, increased by £3.2m to £170.0m.

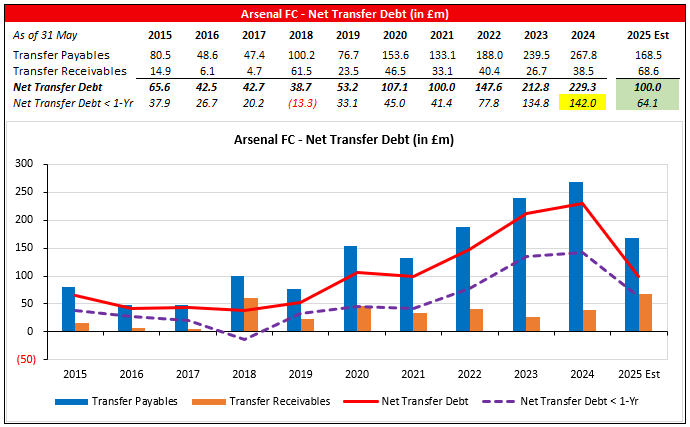
Transfer Debt
As noted in Section 3, the estimate for cash net player spend (£148.8m) exceeds the estimate for net player spend on a cost basis (£19.4m) by £129.3m.
Accordingly, I estimate a YOY decrease for net transfer debt from £229.3m at end-May ’24 to £100.0m at end-May ’25.
Perhaps more notably, I estimate a decrease for net transfer debt due within one year from £142.0m at end-May ’24 to £64.1m at end-May ’25 (YOY: -£77.9m; -54.9%). Lower estimated net installment payables coming due during 2025/26 (vs actual in 2023/24) implies higher capacity for new player investment during the period (all else equal).
Arsenal’s net transfer debt as of end-2023/24 among its domestic ‘Big 6’ financial peer group was effectively in the upper tier of a bimodal outlay (higher: AFC; CFC; MUFC; THFC / lower: LFC; MCFC).
While I’ve only provided estimates for half of the cohort in the figure below, AFC’s end-2024/25 estimate implies a sizeable movement towards the cohort clubs that (on a recent-historical basis) tend to carry lower transfer debt.

Football Net Debt
Football net debt (FND) is an industry-specific metric that aggregates net financial debt and net transfer debt to provide a more complete view of football clubs’ debt obligations.
Summing component figures for AFC results in a football net debt estimate of £372.2m as of end-May ’25 (excluding owner debt: £48.2m), representing an estimated YOY decrease of £132.1m (26.2%).

Based on the estimated YOY (i) increase for adj EBITDA (+18.3%) and (ii) decrease for football net debt (-26.2%), I estimate AFC’s leverage ratio calculated on NFD decreased by 37.6% from 3.6x to 2.3x, with a YOY reduction from 1.3x to 0.3x when excluding owner debt.
The leverage estimate(s) reflect strong capacity to repay obligations from core operations.

Conclusion
The directional views for Arsenal’s 2024/25 financials put forth in this entry entail:
YOY improvement for revenue and key profitability metrics.
Continued strong operating cash flow.
A · net cash player spend outlay that is significantly higher than the net player spend outlay by cost, resulting in a substantial decrease in net transfer debt as of end-May ’25 (compared to end-May ’24).
Continued low external financial debt and associated net cash surplus.
The expected positive operating momentum and strong financial foundation implies meaningful near- and mid-term capacity to invest, which should serve the club well as it competes for top domestic and continental honors.