Liverpool’s 2023/24 financial year ended on 31 May 2024, encompassing a period in which the club finished third in the Premier League (PL) and added one final trophy under since-departed manager Jurgen Klopp through EFL Cup triumph.
With the financial period concluded, this post will provide initial estimates for Liverpool’s 2023/24 profit/(loss) statement.
Housekeeping Notes
As is the case for any individual financial statement, on a stand-alone basis the profit & loss statement is limited. Subsequent entries will estimate other dimensions (investment; cash flow; changes in debt) to complement this analysis and strive to provide a comprehensive set of financial estimates.
More importantly, bear in mind that estimates are (i) subject to revision as new information becomes available and (ii) developed based on judgments and assumptions, and therefore will vary from actual figures. The objective of this exercise is to provide a reasonably accurate picture of financials based on information available.
Profit & Loss Statement Estimates
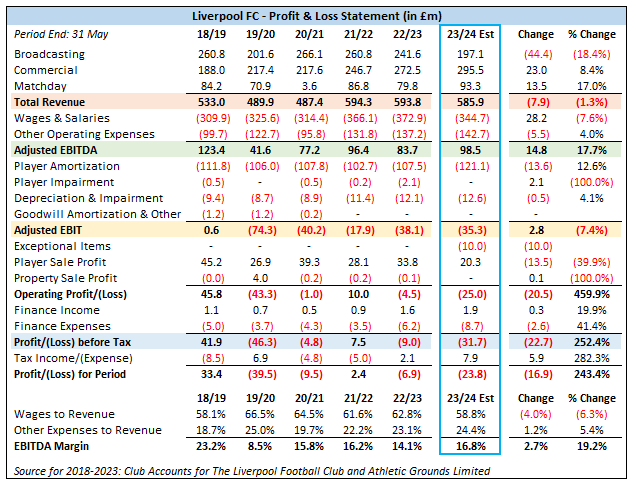
Revenue and key profitability estimates are summarized below, with projected results mixed compared to 2022/23:
Revenue of £585.9m; year-over-year (YOY): -£7.9m (-1.3%)
Adjusted EBITDA of £98.5m; YOY: +£14.8m (+17.7%)
Adjusted EBIT a loss of £35.3m; YOY: +£2.8m (loss reduction of 7.4%);
Pre-tax loss of £31.7m; YOY: -£22.7m (loss widening of 252.4%).
Analysis below provides a top-down discussion of individual line items from broadcast revenue to pre-tax profit.
Broadcast Revenue: Premier League Component
Based on Liverpool finishing two spots higher in the table and appearing one more time on live TV in 2023/24 compared to 2022/23, I’ve estimated that the club earned £169.4m in PL-derived income, representing a £6.5m (4.0%) YOY increase.
Broadcast Revenue: UEFA Component
While domestic league income is expected to modestly increase, UEFA-derived income is estimated to decrease by £50.9m (69.5%) to £22.4m due to participation in the much-less-lucrative UEFA Europa League (UEL) rather than the UEFA Champions League (UCL).
Note that LFC will be competing in the more-lucrative UCL in 2024/25.
Broadcast Revenue: Other
Liverpool generates modest ancillary income from (i) LFCTV, its in-house media network, and (ii) domestic cup prize money. I have assumed this small revenue component was unchanged on net YOY.
Broadcast Revenue (Total)
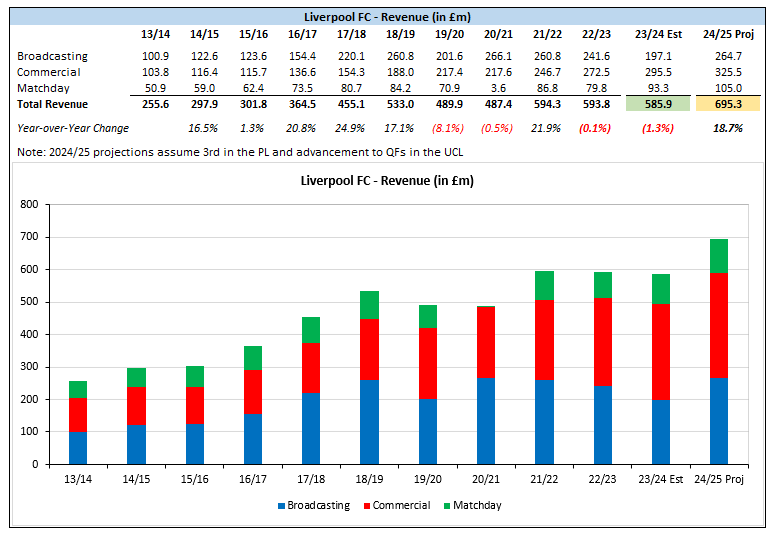
Aggregating estimated YOY changes for PL-derived income (+£6.5m), UEFA-derived income (-£50.9m), and ancillary income (nil) results in a net projected decrease of £44.4m (18.4%) for total broadcast revenue.
Commercial Revenue
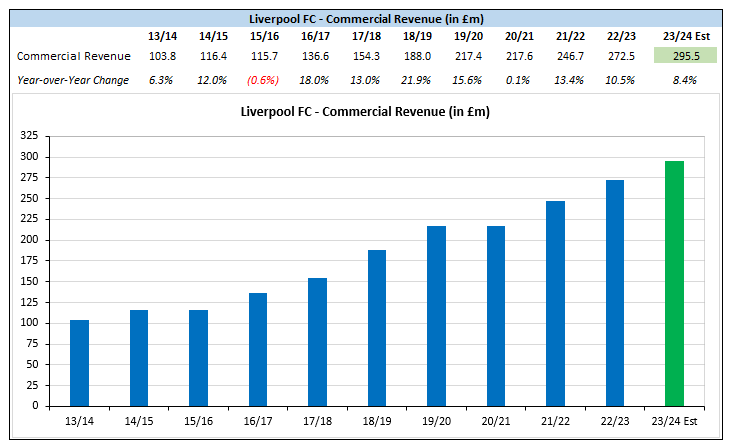
Liverpool’s fastest-growing revenue segment has been commercial, which exhibited a compound annual growth rate (CAGR) of 13.0% from 2016-2023 primarily due to (i) increased value of core partnerships (kit; shirt; sleeve; training), (ii) enhanced breadth of non-core partnerships, (iii) and expansion of retail and merchandising operations.
To estimate 2023/24 commercial revenue and whether recent-historical double-digit growth was maintained, I considered following factors:
Positive:
Standard Chartered (shirt) extended for 2023-2027; reportedly £50m/yr (prior: £40m/yr).
Expedia (sleeve) extended for 2023-2027; less reliable reports of £15m/yr (prior: £9m/yr).
New partnerships announced with Peloton (Jul ’23), Google Pixel (Aug ’23), UPS (Sep ’23), and Orion Innovation (Dec ’23); multi-year extension of the Kodansha partnership.
Neutral: commercial pre-season tour similar in scale and scope to the prior-year tour.
Adverse: no concerts at Anfield (prior year: 3); reduced variable bonuses due to lack of UCL participation.
Based on the overall mosaic, I’ve estimated a £23.0m (8.4%) increase compared to 2022/23, which would be below the 2016-2023 CAGR but nonetheless represent meaningful growth.
Based on recent commercial partnership announcements by the club (AXA; Japan Airlines; STRAUSS) and associated media reports, concerts held at Anfield, a comparatively more extensive pre-season tour versus summer 2023, and the return to the UCL for the upcoming season, strong commercial growth is projected for 2024/25 as well.
Matchday Revenue
Derivation of the 2023/24 matchday revenue estimate considered the following factors:
LFC staged four more home matches than in 2022/23;
Average attendance per home match increased by 4.9% (PL-only: 4.6%);
Ticket prices increased by 2.0%;
The competition mix included (i) UEL matches rather than UCL matches and (ii) a higher proportion of less-lucrative domestic cup matches.
Based on the aforementioned factors, I’ve assumed largely flat YOY per-match revenue (~ neutral impact from bullets #2-#4) to arrive at estimated matchday revenue of £93.3m (YOY: +£13.5m; drive by four more home fixtures).
With Anfield’s capacity expanded to ~ 61k (as of Feb ’24) and a minimum of four UCL home fixtures to be staged in the coming season, Liverpool’s matchday income is likely to cross the £100m threshold in 2024/25.
Total Revenue
Aggregating each revenue segment yields total estimated revenue of £585.9m, representing a projected modest YOY decline of £7.9m (1.3%).
Note that revenue for 2024/25 is projected to increase substantially over the 2023/24 estimate due to (i) the return to the UCL, (ii) further commercial growth, and (iii) the benefit of ARE expansion to be realized for the full period. My preliminary projected increase of ~ £109.6m (18.7%) to £695.3m assumes a third-place finish in the PL and advancement to the quarterfinals of the UCL.
Wage Expense
Due to the opacity of individual sporting contracts, estimating YOY wage changes for LFC (and peer clubs) tends to be a challenging exercise. With that caveat noted, I’ve estimated a YOY decrease of £28.2m (7.6%) to £344.7m based on the following:
Player base wage decrease of £18.2m, reflecting the estimated net impact of:
The exit of a slew of senior squad members (permanent: Henderson; Firmino; Fabinho; Keita; Oxlade-Chamberlain; Milner / loan expiry: Arthur) and loan-out of multiple fringe players (Carvalho; Phillips; Ramsay), partially offset by,
Senior squad additions (Mac Allister; Szoboszlai; Gravenberch; Endo), contract modifications/upsizes (Alisson; Tsimikas; Bajčetić), o and full-year wages paid to a 2022/23 mid-season signing (Gakpo).
Variable player bonus decrease of £15.0m due to participation in the UEL rather than UCL (estimated UEFA-linked income decrease of £50.9m), partially offset by higher variables linked to domestic sporting performance.
For the past decade or so, Liverpool’s player-wage-structure has consistently been reported as highly incentivized, but recent-years wage bill data indicates that underlying variability may be somewhat overstated (which, if overstated, may result from negotiating power of key players at their respective latest contract modifications).
Non-playing-squad wage growth of £5.0m, which is in proximity to the £4.7m component increase from 2021/22 to 2022/23 implied by Liverpool-specific data cited in UEFA’s European Club Finance and Investment Landscape (ECFIL) report.
Note that the resulting wage bill estimate excludes reported compensation of £7.7m to £12.8m (lower end: Liverpool sources; higher end: Dutch sources) to release Arne Slot from his Feyenoord contract to become the new Liverpool head coach effective 01 June 2024.
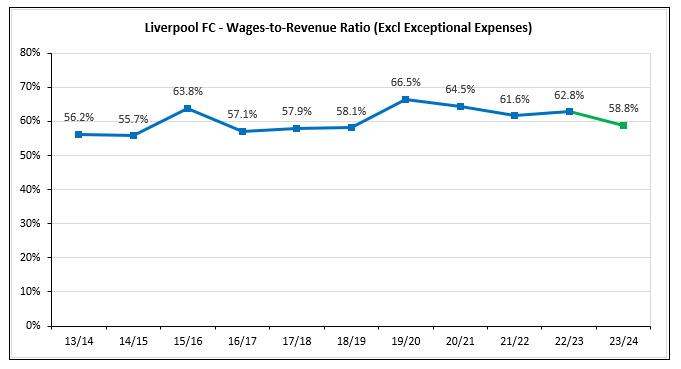
Liverpool’s wage-to-revenue ratio, a critical cost control metric, gradually edged up from 55.7% in 2014/15 to 62.8% in 2022/23 (note: 2019/20 and 2020/21 ratios inflated due to covid impact) as wage growth (CAGR: 10.5%) outpaced revenue growth (CAGR: 9.0%) over the 8-year period. I have estimated material wage bill rebalancing for 2023/24 that reduces the ratio to 58.8% (closer to pre-covid-impact norms), but I stress that the estimate relies on assumptions in an opaque financial space.
Other Operating Expenses
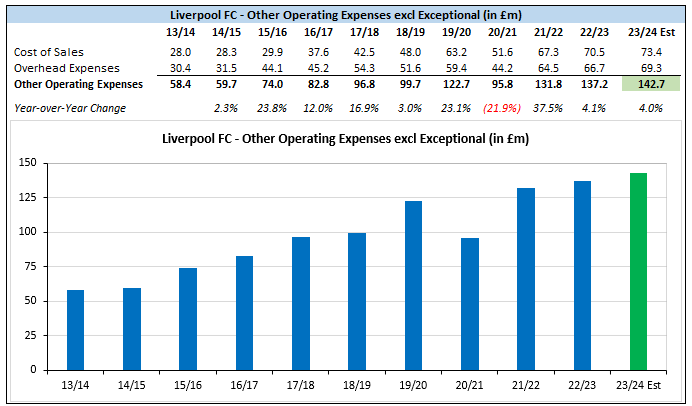
Liverpool’s other (cash) operating expenses were £137.2m in 2022/23, which included, but were not limited to, costs related to staging matches, merchandising, maintenance, transportation, utilities, and insurance. Like for wages, other operating expenses (OOEs) have increased at a faster rate than revenues since 2014/15 (OOE CAGR: 10.5%; revenue CAGR: 9.0%).
To derive the 2023/24 OOE estimate, the following factors were considered:
LFC staged four more home matches and three fewer concerts compared to 2022/23 (modest net increase);
General inflationary pressures (net increase), which abated compared to the 2022/23 period but remained above historical norms (note: ONS CPI data as reference);
The summer 2023 pre-season tour was similar in scale and scope to the summer 2022 pre-season tour (neutral impact).
Based on the aforementioned factors, I’ve estimated a £5.0m (4.0%) YOY increase in OOEs. Note that this figure excludes any costs absorbed by the club in relation to the sale of a minority interest to Dynast Equity announced in September 2023.
The OOE-to-revenue ratio is estimated to increase from 23.1% to 24.4% (on the high end of the historical range), reflecting higher estimated OOEs versus modestly lower estimated revenue.
Adjusted EBITDA
Adjusted earnings before interest, tax, depreciation, and amortization (adj EBITDA), which also excludes exceptional items and profit from fixed asset sales, is generally viewed as a proxy for cash profit. Based on derived estimates for revenue and recurring cash expenses, I have estimated adj EBITDA to increase YOY from £83.7m to £98.5m (+17.7%) and associated adj EBITDA margin to increase from 14.1% to 16.8%. Expected improvement is driven by a projected material wage bill decrease, partially offset by growth in OOEs and slightly reduced revenue.
While I have estimated YOY improvement for adj EBITDA and adj EBITDA margin, note that:
Projected margin remains below pre-covid-impact club norms (2023/24 estimate: 16.8%; actual margin 20.1% to 24.2% for 5 of 6 years from 2013-2019);
Peer club and sporting rival Manchester United provided guidance that its 2023/24 adj EBITDA will be ~ £140.0m with associated margin of ~ 21.2%.
Liverpool’s EBITDA was fifth among ‘Big 6’ clubs in 2022/23, and I expect the same placement within the peer group in 2023/24.
Amortization Expense
Liverpool’s player amortization expense in 2022/23 was £107.5m, representing the write-down of transfer fees and other costs (e.g. agents’ fees) incurred to bring player registrations to their current condition.
For 2023/24, I’ve estimated an increase in player amortization to £121.1m (+12.6%) due to the impact of new signings, partially offset by player registration disposals and contract modifications. Note that estimates include modeled impact from fees to intermediaries (rather than transfer fee only).
Note that non-cash-flow estimates related to intangible assets assume no player impairment or non-player amortization.
Depreciation Expense
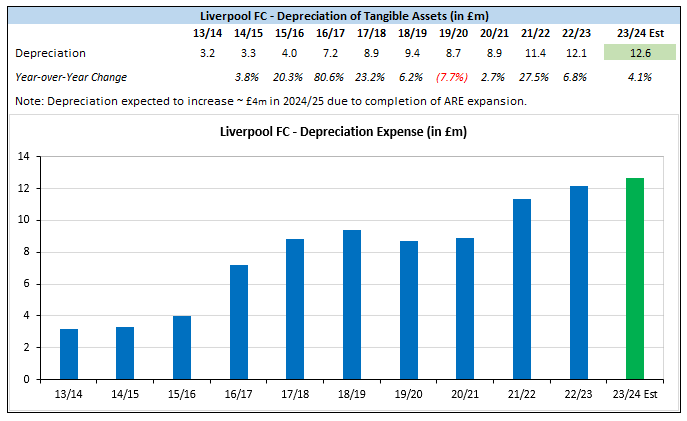
I have estimated a £0.5m (4.1%) increase in depreciation expense for 2023/24, driven by the incremental impact of (i) the Melwood buyback for £13.0m on 07 June 2023 and (ii) general maintenance capex requirements.
Note that the estimate assumes ARE costs continued to be aligned to ‘assets under construction’ (AUC) through 31 May 2024 as there are reports of final work persisting into this summer. If this treatment is incorrect and costs were transferred from AUC to ‘stands, fixtures, fittings, and equipment’ as the date the Anfield Road stand accommodated full expanded capacity for a live event (February 2024), then my estimate will likely be lower than actual by ~ £1.0m.
Adjusted EBIT
Adjusted earnings before interest and taxes (adj EBIT), which, like adj EBITDA, also excludes exceptional items and profit from fixed asset sales, is generally viewed as a proxy day-to-day profit/(loss). Based on derived estimates for adj EBITDA, amortization, and depreciation, I’ve estimated an adj EBIT of negative £35.3m for 2023/24. While the estimate is a modest improvement versus 2022/23, it would represent the fifth consecutive year of day-to-day losses.
Exceptional Items
Fenway Sports Group, Liverpool’s controlling owners, sold a small stake in the club to sports investment firm Dynasty Equity for an undisclosed amount in September 2023 (media reports: £81.9m to £163.8m; private market data provider PitchBook: £153.1m).
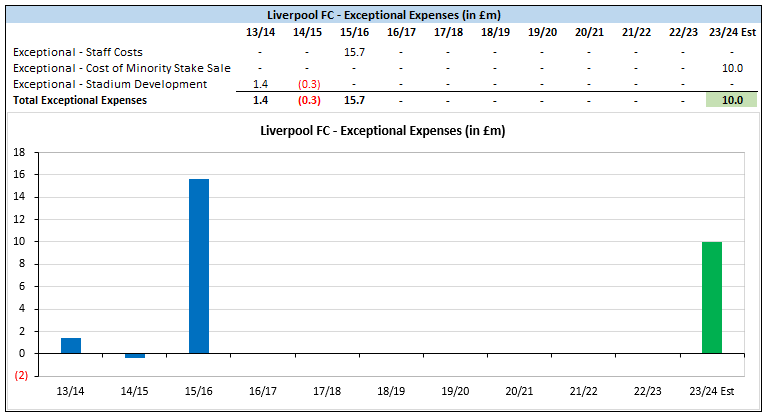
I’ve assumed that Liverpool absorbed a £10.0m cost associated with the strategic review and executed sale of the minor stake (~ 1.9% to 3.8% based on media reports). on media reports).
Note that peer club Manchester United (NYSE: MANU), who are the only current PL club to publicly release quarterly financials, disclosed exceptional expenses of £39.9m for the nine months ended 31 March 2024 in relation to the strategic review, sale agreement, subsequent executed sale, and follow-on investment that resulted in Sir Jim Ratcliffe (SJR) accumulating a 27.7% stake (economic and voting) in the club for $1.5bn (initial £1.3bn and £0.2bn follow-on).
Liverpool’s parallel sale process resulted in a much smaller and (indicatively) less complex transaction, therefore I’ve assumed a much a significantly smaller total cost (albeit at a higher percentage of transaction amount).
Player Sale Profit
Liverpool disclosed in the note for subsequent events in 2022/23 accounts that player sale profit was £19.3m for 01 June 2023 to 27 September 2023 (date of the auditor’s report).
Building on the note for subsequent events, I’ve assumed an additional £1.0m was recognized after 27 September 2023 via crystallized add-ons (related to the sale of Minamino) to arrive at full-year player sale profit estimate of £20.3m (note that January 2024 transfer window outgoings were limited to part-season loans).
As an aside, The Athletic reported that Fabinho was sold for £40.0m and Jordan Henderson was sold for an initial (guaranteed) fee of £12.0m. Assuming accurate reporting, Liverpool’s modest summer 2023 player sale profit implies some combination of (i) high fees paid to agents to facilitate the transactions, (ii) meaningful variables included in the Fabinho sale, and/or (iii) departing players having a higher aggregate remaining book value at sale than would be expected based on reported transaction data.
Net Finance Costs
I’ve estimated a 49.0% increase in net finance costs from £4.5m to £6.8m (note: net cash interest payments estimated to increase from £4.1m to £6.0m), primarily driven by higher estimated usage on the club’s revolving line of credit (particularly pre-Dynasty Equity investment) and higher interest rates compared to 2022/23.
Pre-Tax Profit/(Loss)
Incorporating the estimates for exceptional items, player sale profit, and net finance costs results in an estimated pre-tax loss of £31.7m (note: overall loss of £23.8m), reflecting a projected widening of the pre-tax loss by £22.7m compared to 2022/23.
The estimated pre-tax result would represent the worst since 2012/13 (pre-tax loss of £49.8m) excluding the covid-impacted 2019/20 period.
Conclusion
This initial version of 2023/24 P&L estimates for Liverpool entails projected revenue of £585.9m, Adj EBITDA of £98.5m, Adj EBIT of negative £35.3m, and a pre-tax loss of £31.7m, representing anticipated mixed performance versus 2022/23 actuals.
However, on a stand-alone basis the P&L metrics discussed provide limited insight into cash sources and uses during the year and how debt, both financial and transfer-related, may have changed from 31 May 2023 to 31 May 2024.
Therefore, the two forthcoming entries in this series will turn to these elements to provide a more comprehensive financial picture, beginning with the net cost of investment across player trading and infrastructure during the period.


