


Liverpool FC - 22/23 P&L Statement Estimates
Initial LFC Financial Estimates: Part 1

Liverpool’s disappointing 22/23 season is over, with the club finishing 5th in the Premier League, exiting the UEFA Champions League in the round of 16, and suffering early elimination in each domestic cup competition.
With the season in the rear view, this post will estimate Liverpool’s operating performance off the pitch in the form of the 22/23 profit & loss statement.
Housekeeping Notes
As is the case for any individual financial statement, on a stand-alone basis the profit & loss statement is limited. A full estimation of financial performance for 22/23 requires projections for investment, cash flow, and changes in debt as well, which are dimensions that will be discussed in subsequent entries over the coming weeks.
More importantly, bear in mind that estimates are (i) subject to revision as new information becomes available and (ii) developed based on judgments and assumptions, and therefore will vary from actual figures. The objective of this exercise, and updates to estimates in the coming months, is to provide a reasonable picture of general financial performance and condition.
P&L Statement Estimates for 22/23
With the decline of on-field performance, I am expecting a decline in revenue and key profitability measures, but I am not projecting significant decreases (note there will be rounding impact for some figures):
Revenue estimate of £578.6m, a decline of £15.7m from the club-record £594.3 in 21/22.
Segments: commercial up £15.0m; broadcast down £20.5m; matchday down £10.2m.
EBITDA estimate of £89.3m, a decline of £7.1m from £96.4m in 21/22.
Attribution: revenue down £15.7m vs cash expenses down £8.5m.
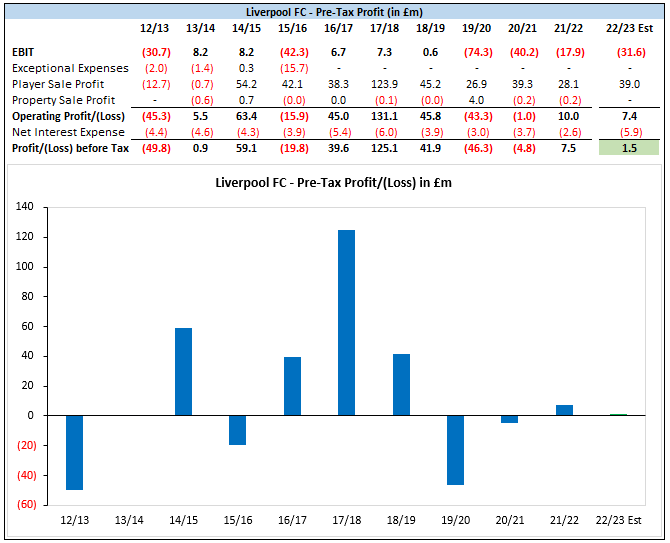
EBIT estimate of negative £31.6m, a worsening of the 21/22 result by £13.7m.
Attribution: EBITDA down £7.1m and non-cash flow expenses up £6.6m.
Pre-tax profit estimate of £1.5m, a decline of £6.0m from 21/22.
Attribution: EBIT down £13.7m; fixed asset sale profit up £11.0m; net interest expense up £3.3m.

The following analysis discusses the rationale behind each line-item estimate, moving top down from commercial revenue to pre-tax profit.
As a small aside, I normally provide a 5-years of historical data in figures to outline trends. However, a longer look-back period is more aesthetic on Substack, so many figures that follow will extend the historical data to 7 to 10 years.
Commercial Revenue
Liverpool’s commercial revenue grew from £115.7m in 15/16 to £246.7m in 21/22, a total increase of 113% over the six-year period, representing a compound annual growth rate (CAGR) of 13.5%.
This rapid growth was facilitated by the (i) increased value of core partnerships (kit; shirt; sleeve; training), (ii) addition of numerous smaller, non-core partners, and (iii) expansion of retail and merchandising operations.

To estimate commercial revenue in 22/23 and whether this spectacular growth was maintained, I considered the following factors:
The club embarked on a pre-season tour in summer 2022, playing friendly matches in Thailand and Singapore, after conducting no tour in summer 2021. LFC also played two (less lucrative) mid-season friendlies in the Dubai Super Cup during the World Cup break.
LFC announced a new partnership with Coca-Cola on 29 September 2022, one-third of the way into the 22/23 period.
Also, the club announced multiple new partnerships in 21/22, including Sonos (10 August 2021), Vistaprint (03 February 2022), and Wasabi (23 February 2022), that will cover the full financial period in 22/23.
Three concerts were staged at Anfield in June 2022 (The Rolling Stones; Elton John; Eagles) versus none the prior year.
Potential adverse impact on commercial revenue from poorer on-pitch performance compared to 21/22, particularly with regards to merchandising given the highly-variable structure of the Nike deal.
The impact of the pre-season tour will be a needle-mover, with my expectation that revenue generated was in the region of £10m. The basis for the estimate is a combination of (i) peer club Manchester United’s disclosure in 2023Q1 financials that their pre-season tour was the primary driver of a £21.5m increase in sponsorship revenue over 2022Q1 (the exact attribution was not provided; I’ve assumed mid-teens for tour impact) and (ii) Liverpool’s tour being less extensive in comparison.

Regarding non-tour factors, despite the uplift from three concerts staged at Anfield early in summer 2022, I’m estimating a net increase of only £5m as (i) it appears commercial partnership growth was very modest in 22/23 compared to what was observed for 2016-2022 and (ii) I expect income generated from the highly-variable Nike deal decreased slightly year-over-year. If there are reliable reports that kit sales and/or other merchandising under the Nike deal did not decline (or have set new records), then I will revise this estimate upwards accordingly.
Aggregating my anticipated tour and non-tour related impacts results in an estimated £15m increase, which would take commercial revenue to £261.7m, a 6.1% increase over 21/22. This would represent a slowdown from the CAGR of 13.5% across the 2016-2022 period.

Note that for 23/24, there have been reliable reports on the following elements associated with commercial revenue:
The Standard Chartered shirt sponsorship will increase from £40m to at least £50m per year, running from 2023 to 2027.
The Expedia sleeve sponsorship will increase from £9m to £15m per year, also running from 2023 to 2027.
The club will embark on a one-stop tour to Singapore in summer 2023, which I expect will generate revenue in line with that generated in 2022.
Income generated from non-football events will decrease, as Liverpool will not be staging any events at Anfield in summer 2023 as the final phase of the Anfield Road End (“ARE”) expansion is completed.
Broadcast Revenue - Premier League
Liverpool earned £151.9m from Premier League (PL) central media distributions in 21/22, a season in which the club finished second and appeared 29 times on live TV in the UK.

For 22/23, despite finishing three positions worse in the table appearing once fewer on live TV, Liverpool will see uplift in league broadcast revenue due to the new PL broadcast rights deal for the 2022-2025 cycle, as (i) the value of international rights and central commercial rights are both increasing substantially and (ii) the increase from international rights is being allocated primarily to merit payments.
Key changes to the media rights deal as reported by the Athletic and structural considerations as outlined in the 22/23 PL Handbook are summarized in the table below.

Calibrating to these elements, I estimate the amount distributed to PL clubs in total for 22/23 will increase by 11.2% over 21/22, with equal share payments increasing from £87.5m to £92.0m per club (5.2% increase), the value of one position in the table increasing from £2.1m to £3.0m (44.8% increase; see the impact on the dispersion ratio in the figure below), and the value of one incremental TV appearance unchanged.

Based on (i) my estimates for component pools and (ii) how the PL structures payouts to individual clubs for equal share, merit, and facility fee (TV appearance) components, I project that Liverpool will earn £164.1m in domestic broadcast income in 22/23, an 8.1% increase over the $151.9m in 21/22.
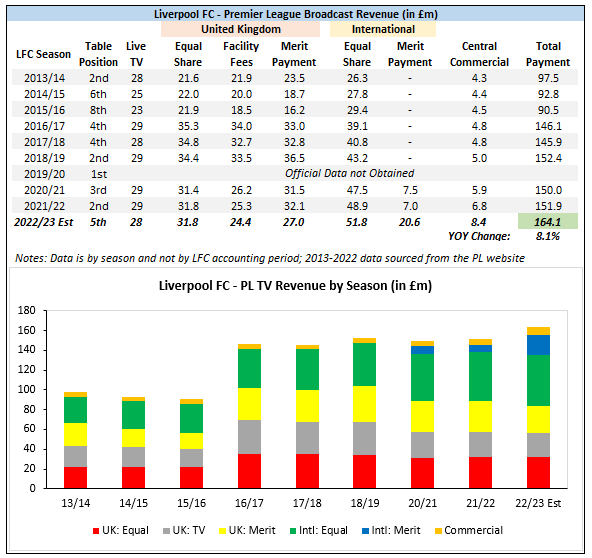
The actual value of central distributions by club will likely be published by the Premier League in the next 3 to 6 weeks, which will result in this estimate being replaced by the actual value once released.
Broadcast Revenue - UEFA
Liverpool advanced to the round of 16 of the UEFA Champions League (UCL) in 22/23, where they fell to Real Madrid. Based on the distribution framework outlined by UEFA, I estimate that Liverpool’s participation in the competition will yield revenue of £70.7m.

This estimate represents a steep YOY decline of £31.8m compared to the estimated £102.5m earned in 21/22, when the club earned three additional stage-advancement bonuses for reaching the final of the competition (as a technical note, the amount earned by LFC is known to be €120.0m for 21/22, but translation to GBP requires an exchange rate estimate).

While the estimated YOY decline is steep, £70.7m earned in 22/23 would take UEFA broadcast revenue to ~ £494.6m across 2017-2023 (£82.4m per year), a figure that demonstrates how lucrative the continuous participation in the UCL has been for LFC over the past 6 years, and how impactful failing to qualify for the 23/24 edition will be. Even if Liverpool were to make a deep run in the UEFA Europa League in 23/24 (the competition for which the club qualified), the revenue earned from the competition would likely be less than half the revenue LFC earned from a Champions League round of 16 exit in 22/23.
Broadcast Revenue - Aggregate
In addition to the estimated £234.8m in broadcast revenue generated from the PL (£164.1m) and UEFA (£70.7m), I project that LFC will earn £5.6m in broadcast revenue from ancillary sources, primarily from LFCTV (£5.4m), the club’s in-house media channel. The estimate for LFCTV was derived by applying a 20% haircut on Manchester United’s disclosed revenue associated with MUTV of £6.8m in 21/22 accounts.
Incorporating the modest income from other sources results in a total broadcast revenue estimate of £240.4m for 22/23, a £20.4m (7.8%) decrease attributable to the estimated reduction in UEFA income exceeding the estimated increase in PL income.

Matchday Revenue
Since the Main Stand was expanded in summer 2016, excluding the 20/21 season where there were no home matches at full capacity, Liverpool have generated £2.88m to £3.24m per home match in individual seasons. Across these prior five seasons, the median and average per-home-match revenue were both £3.06m, which serves as the per-home-match estimate utilized for 22/23.
Given that Liverpool staged 25 home matches in 22/23, the resulting matchday revenue estimate is £76.6m, a £10.2m reduction from the £87.8m earned in 21/22 due to the reduced number of home matches stemming from poorer progression in cup competitions.

It is worth noting that Anfield’s capacity will increase from ~ 54k to ~ 61k when ARE expansion is completed in Summer 2023, which I expect will increase revenue by £600k to £800k per home match (£15m to £20m in a season with 25 home matches).
Total Revenue
Aggregating the estimate for each segment yields total projected revenue of £578.7m, a projected YOY decline of £15.6m (2.6%).
Key observations with regards to the total revenue estimate:
Commercial is estimated to be the largest revenue source in 22/23 (45.2% of total projected income), overtaking broadcast.
My revenue projection for 22/23 is £123.6m higher than revenue generated in 17/18 (27.2% total growth; 4.9% CAGR), with £107.4m of that projected increase (86.9%) attributable to commercial growth.
Had Liverpool achieved the same level of sporting success in 22/23 as 21/22 (2nd in PL; final of UCL) I estimate revenue would be ~ £65m to £80m higher (broadcast ~ £45m; matchday ~ £10m to £15m; commercial ~ £10m to £20m) than the current estimate, climbing into the mid-£600m range.

Wage Expense
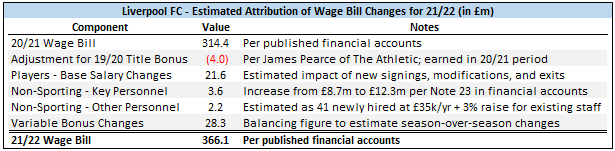
Liverpool’s wage bill was £366.1m in 21/22, representing a £51.7m increase over 20/21 and a record level for the club (previous high: £325.6 in 19/20). While attribution between factors is extremely difficult due to the private nature of wage details, I have very roughly estimated that £28.3m resulted from increases in variable bonuses between seasons, £21.6m from player base wage changes, and £1.8m on net from other elements.
To estimate the total wage bill for 22/23 I considered each of these dimensions (sporting base wages, sporting variable wages, non-sporting salaries) separately, with the core focus on sporting wages.
With regards to base wages of sporting staff, I estimate an increase of £18.4m due to:
A net increase of £16.4m resulting from player acquisitions, contract modifications, and player departures.
An increase of £2.0m in backroom coaching staff salaries resulting from manager Jurgen Klopp’s latest contract extension as reported by The Athletic.

For YOY changes associated variable bonuses, given that (i) LFC have a long-favored a policy of handing out player contracts that are heavy on performance-related bonuses and (ii) sporting performance was considerably worse in 22/23 compared to 21/22, I expect a significant reduction from this element.
To quantify the reduction, my estimate reverses the £28.3m increase from 20/21 to 21/22 then adds an additional £5.0m reduction for 22/23 being worse in terms of sporting achievement compared to 20/21 (one stage worse advancement in the UCL; finishing two places lower in the table), resulting in a £33.3m fall in variable sporting bonuses.
Incorporating these factors along with an estimated net £1.2 increase in wages related to non-sport staff results in a wage estimate of £352.4m for 22/23, a projected reduction of £13.7m.
This wage bill estimate would, like revenue, represent the second highest figure in the club’s history.

The resulting wage-to-revenue estimate for 22/23 is 60.9%, a slight drop from 61.6% in 21/22. Note that modest drop is attributable to the projected impact of the new PL broadcast rights deal. If the positive uplift from that deal were not present, I estimate that the wage-to-revenue ratio would have edged up to 62.2%.

Other Cash Expenses
Liverpool’s other cash expenses were £131.8m in 21/22, which include, but are not limited to, costs related to staging matches, merchandising, maintenance, transportation, utilities, and insurance.
For 22/23, the following factors were considered to develop an estimate:
Five fewer home matches were staged as compared to 21/22.
Incremental costs incurred associated with (i) the preseason tour to Asia, (ii) three concerts staged at Anfield, and (iii) the two-week mid-season training camp in Dubai during the World Cup break.
Per Dominic King on 28 FEB 2023, the club had seen a 100% increase in utility costs in the prior 12 months (encompassing a notable segment of the 22/23 period), with the total annual costs of running Anfield rising 40% since 2017.
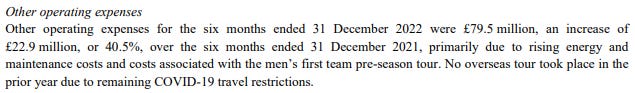
Peer club Manchester United reported in their 2023Q2 interim report that other operating expenses were £79.5m for the first six months of 22/23, an increase of £22.9m (40.5%) over the first six months of 21/22, citing the preseason tour and rising energy and maintenance costs as key drivers.
The overall mosaic points to growth in this expense category for 22/23, for which I have modeled a 1.5% increase in the ratio of non-wage cash expenses to revenue (from 22.2% to 23.7%).

Using this approach/assumption results in an estimated non-wage cash expense of £137.0m for 22/23, a projected YOY increase of £5.2m (4.0%).

As an aside, I recognize that this estimated YOY change for LFC is very modest compared to the period-over-period increase that MUFC have reported for just the first half of 22/23. The basis for difference is that MUFC’s partial year results include (i) a more extensive pre-season tour than LFC conducted, (ii) no reduction in staged home matches (12 as of 31 December for each season), and (iii) a £4.3m increase in foreign exchange losses from operating activities (LFC’s other operating expenses don’t historically include FX gains/losses).
As I review MUFC 2023Q3 and full-year financial results upon release, as well as full-year results for other peer clubs that report before LFC, I will be tracking this expense category closely, and if it appears that I’ve understated this expense for LFC then I’ll revise upwards.
EBITDA
Earnings before interest, tax, depreciation, and amortization (EBITDA) is generally viewed as a proxy for cash profit. Note that this is an adjusted measure that excludes exceptional items and, for football clubs, also excludes profit from fixed asset sales.
EBITDA is particularly important to clubs that operate on a self-sustaining model, as the measure is an indicator of an entity’s ability to organically generate cash to meet obligations (transfer installments coming due; any financial debt requirements) and invest in fixed assets (player registrations; infrastructure). It is no surprise then that LFC identifies EBITDA is a Key Performance Indicator, the only profitability metric classified as such by club management.

For LFC in 22/23, my estimates for revenue and cash expenses yield an EBITDA of £89.3m, a reduction of £7.1m from 21/22. The resulting EBITDA margin of 15.4% would entail a modest decrease from the 16.2% realized in 21/22.
Due to the growth in cash expenses outpacing revenue growth, the EBITDA margin in 21/22 was disappointing when compared to pre-covid norms (5 of 6 years pre-covid saw EBITDA margins of 20.1% to 23.2%), and I expect 22/23 to be similar.

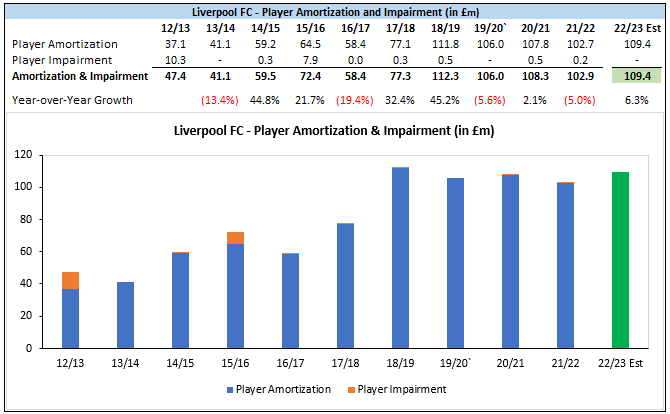
Player Amortization
Liverpool’s amortization expense in 21/22 was £102.7m, representing the write-down of transfer fees and other costs (e.g. agents’ fees) incurred to bring player registrations to their current condition.
The method I used to estimate amortization expense for 22/23 entailed adjusting the 21/22 value for the impact from (i) new signings, (ii) contract modifications, and (iii) departures, with academy graduates and other players judged to have de minimis influence excluded from the analysis.
For the new signing segment, I have estimated an incremental increase of £23.4m attributable to recent acquisitions, with the majority stemming from the signing of Darwin Nunez from Benfica.

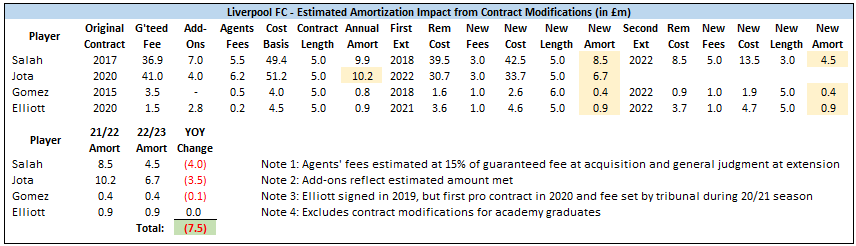
With respect to relevant contract modifications, I estimate the impact as a £7.5m reduction, driven by the summer 2022 extensions between the club and Mo Salah and Diogo Jota.
Finally, I estimate the impact from departures to be a £9.2m reduction, with more than 60% attributable to Sadio Mane’s exit when his player registration was sold to Bayern Munich.

Summing the impacts of all three segments yields an estimated net increase of £6.7m, which would result in a player amortization expense of £109.4m in 22/23. While this figure would entail an increase of more than 6% over 21/22, it would be slightly lower than the high-water mark of £111.8m in 18/19.
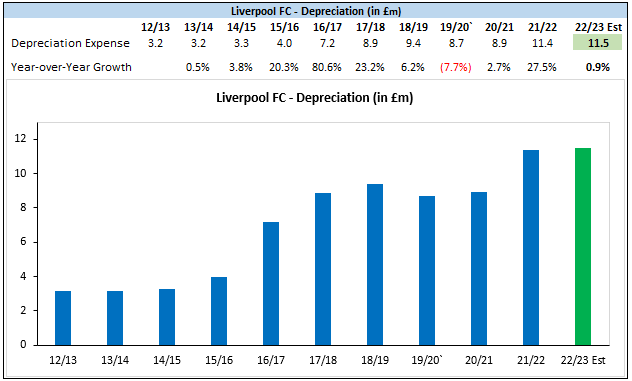
Depreciation Expense
Liverpool’s depreciation expense is unlikely to change significantly in 22/23 as costs related to the Anfield Road End expansion won’t start being written down until completion in summer 2023 (early in the 23/24 financial period).
My assumption is that £5m in costs not associated with ARE were incurred during the year, with those costs depreciated at a 2% rate. This would result in a very slight increase in depreciation expense from £11.4m to £11.5m.
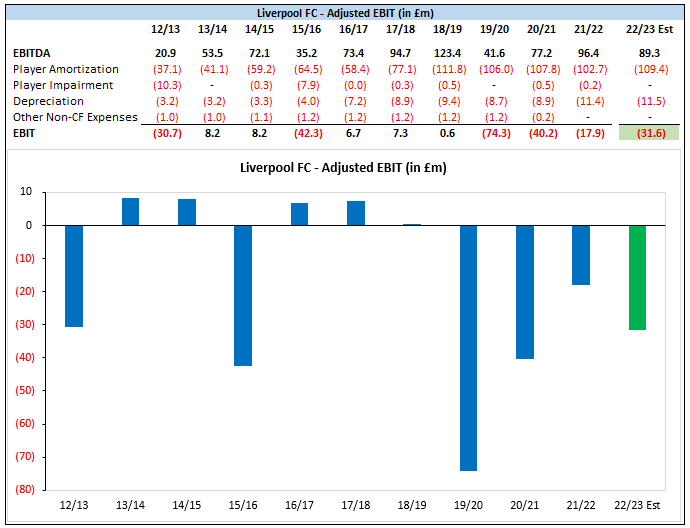
EBIT
Earnings before interest and taxes (EBIT), which like EBITDA excludes fixed asset sale profits (a variable and non-core activity) and exceptional items, is considered a proxy for day-to-day profit/(loss).
I am estimating that Liverpool’s day-to-day loss in 22/23 will be £31.6m, a £13.7m YOY increase driven by the decrease in EBITDA and increase in non-cash-flow expenses.
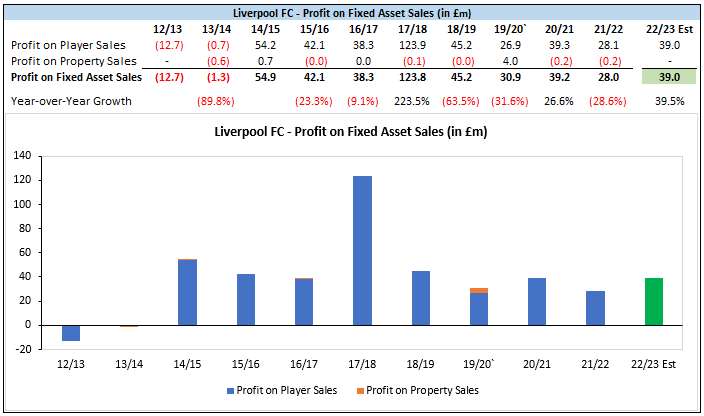
Profit from Disposal of Player Registrations
Per the note for contingencies and subsequent events in 21/22 accounts, Liverpool generated a player sale profit of £36.0m from 01 June 2022 to 29 September 2022 (date of the auditor’s report), with 34.6m attributable to new disposals and £1.4m resulting from crystallized add-ons from pre-22/23 activity.

These inputs are extremely useful for estimating player sale profit for the full year, as the full year profit will be the £36.0m disclosed in subsequent events plus the profits from the January 2023 window (where activity was de minimis) and any further add-ons crystallized for the remainder of the season, whether resulting from summer 2022 exits (Mane, Minamino, etc) or from prior years (of which there was only £2.1m unmet as of account preparation).
Given this outlay, I’m projecting a player sale profit for 22/23 of £39.0m, which adds £3.0m in newly met add-ons (primarily related to Mane’s sale) to the subsequent events figure. This result would entail a £10.9m increase over 21/22 and in line with the median of the prior 7-years (£39.3m).
Note that I have modeled property sale profit as nil given that, excluding the sale of Melwood in 19/20, there tends to be no meaningful impact from the source and there were no reports of notable property sales during the 22/23 financial year.
Net Interest Expense
Liverpool’s net interest expense in 21/22 was a very modest £2.6m, the lowest figure of the past decade as rates remained low, the club reduced the balance on its revolving line of credit further from the elevated balance at peak covid uncertainty, and interest expense resulting from net transfer installment debt was low.
For 22/23, I’m projecting that this figure will increase to £5.9m due to an estimated increase in borrowing (to be discussed in a subsequent entry) and the notable year-over-year rise in UK base rates.

Pre-Tax Profit/(Loss)
Incorporating the estimates for player sale profit and net interest expense results in a pre-tax profit of £1.5m, which is a projected reduction of £6.0m from 21/22.
Among PL clubs in 21/22, only 7 of the 20 (including LFC) disclosed a pre-tax profit, with the median result a pre-tax loss of £23.9m. Under that lens, a small pre-tax profit wouldn’t be a bad result.
However, by club’s historical standard for non-covid-impacted years, the result would be relatively underwhelming given that the average pre-tax profit was £49.2m from 2014-2019 (median: £41.9m).
Conclusion / Subsequent Entries
This initial version of 22/23 P&L estimates for Liverpool has projected EBITDA of £89.3m, EBIT of negative £31.6m, and pre-tax profit of £1.5m, each representing a modest expected decline from 21/22 levels.
However, for Liverpool, a club that under FSG is very cash-flow-sensitive and averse to high levels of debt, on a stand-alone basis these estimates provide limited insight into cash sources and uses during the year and how debt, both financial and transfer-related, may have changed from 31 May 2022 to 31 May 2023.
The entries to be published in the coming weeks will turn to these elements, beginning with the net cost of investment across player trading and infrastructure during the year.
The target date for that entry is Sunday, 04 June, but it could be earlier or later depending on my capacity to draft the write-up.
loved your thorough breakdown!