Manchester City FC published financial accounts for 2023/24, a period in which the club claimed its fourth consecutive Premier League (PL) title and triumphed in both the UEFA Super Cup and FIFA Club World Cup.
This post summarizes financial results for the period, with analysis covering the following dimensions:
Profit/(loss) statement;
Fixed asset investment (player and infrastructure);
Cash flow statement (note: estimates only);
Financial debt and transfer debt.
Legal Entity Analyzed
For orientation, the specific legal entity reviewed is Manchester City Football Club Limited (outlined in red in the organization chart), which will be referred to interchangeably as Manchester City FC, Manchester City, MCFC, and City in this entry.
Housekeeping Note: Premier League Charges
The Premier League leveled more than 100 charges against Manchester City in February 2023, which accused the club of (i) providing inaccurate financial information for 2009-2018, (ii) not fully disclosing manager renumeration for 2009-2013 or player renumeration for 2010-2016, (iii) breaching UEFA’s Financial Fair Play (FFP) rules for 2013-2018, (iv) breaching Premier League Profitability & Sustainability (P&S) rules for 2015-2018, and (v) failing to cooperate with the Premier League’s investigation for 2018-2023.
The hearing into the charges, which Manchester City deny in their entirety, was held before a three-person independent commission from 16 September 2024 to 06 December 2024. A ruling by the independent commission is expected around March 2025.
While the ruling is pending, my discussion of Manchester City’s financials will maintain a neutral view on the quality of information for periods in which auditors identify no red flags (note: the club’s auditors have assessed financial statements as providing a true and fair view each year from 2009 to 2024).
Section 1 – Profit/(Loss) Statement
Manchester City’s revenue and key profitability metrics are summarized below, with 2023/24 results exhibiting relatively modest variability versus 2022/23 (particularly by football club standards):
Revenue of £715.0m; slight increase of £2.3m (0.3%) versus 2022/23; note that the static year-over-year (YOY) profile also extends to individual segments as each segment changed by < £5.0m YOY.
Adjusted EBITDA of £117.2m; YOY decrease of £5.9m (4.8%) due to increased non-wage cash operating expenses, partially offset by a modest decrease in wages and slightly higher revenue.
Adjusted EBIT of negative £60.5m; YOY widening of the loss by £26.1m (75.8%) attributable to reduced adj EBITDA and a £19.6m increase in player amortization.
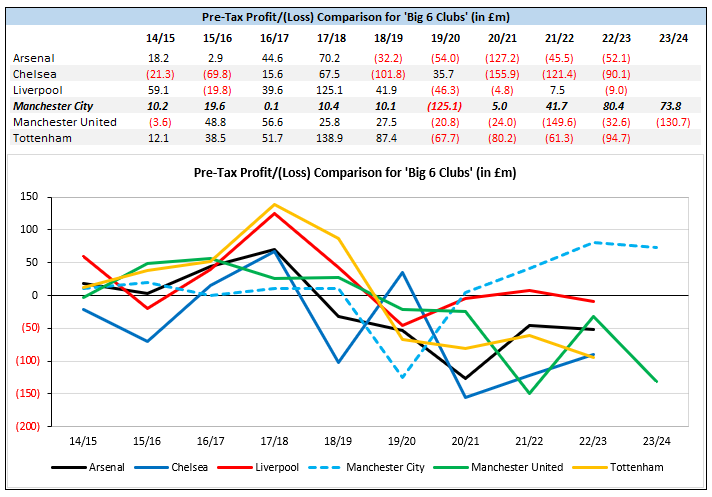
Pre-tax profit of £73.8m; YOY decrease of £6.6m (8.2%); while a modest reduction was exhibited, the result is very strong by industry standards; the outsized overall business result for each of the past two years has owed heavily to substantial player sale profit.
Total Revenue
Manchester City’s total revenue of £715.0m narrowly represents a new club (and PL) record. While the YOY improvement was modest, there is an element of resilience for revenue to slightly increase despite (i) the quarterfinal exit in the UEFA Champions League (UCL) versus winning the competition in 2022/23 (reduced prize money YOY) and (ii) fewer staged home matches (2023/24: 26; 2022/23: 30) for matchday income generation.
Only two PL clubs have posted financials results for 2023/24 thus far: Manchester City and local rivals Manchester United. City’s revenue exceeded United’s by £53.3m (8.0%), which is the fourth consecutive year City has posted higher revenue.
Note that none of the 18 PL clubs yet to publish financials will exceed Manchester City’s revenue figure, therefore City’s revenue will stand as the highest in the league for the period.
Revenue Segment: Commercial
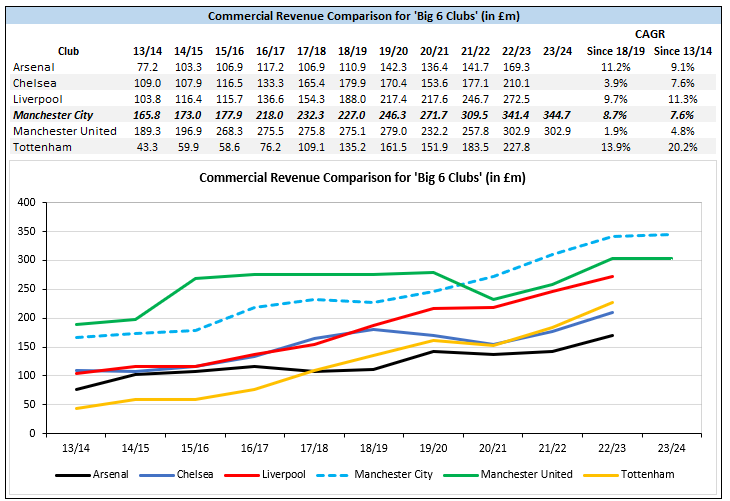
Commercial revenue increased modestly from £341.4m to £344.7m (+0.9%), with the club attributing growth to (i) new partnerships (such as Kellogg’s and JankoSolar) and (ii) growth in value for existing partnerships (including, but not limited to, the expanded OKX relationship).
The markedly slower-than-normal YOY growth is likely partially due to a lack of concerts at the Etihad Stadium during the 2023/24 financial period versus 5 shows staged during the 2022/23 period.
Based on the high volume of sponsorship-related announcements since Jul ’24, which include, but are not limited to, new relationships with Betway, C.P. Company, Corpay, Yili, Jacob & Co, and StairMedia and a new strategic collaboration with Sony, it is reasonable to expect stronger YOY commercial growth for the 2024/25 period.
Manchester City’s commercial revenue ascended to top of its ‘Big 6’ domestic peer group (and, therefore, top among PL clubs) in 2020/21 and will retain that position for 2023/24 despite the modest YOY increase.
Revenue Segment: Broadcast
Broadcast revenue decreased by £4.7m (1.6%) from £299.4m to £294.7m, driven by a decrease in UEFA-sourced income by £9.3m (8.1%) from £113.9m to £104.6m that was partially offset by a £4.6m (2.5%) increase in PL and other income from £185.6m to £190.1m (note: rounding impact; also present for various cited figures later in this entry).
Decreased UEFA broadcast revenue YOY is due to lower prize money from poorer performance (2023/24: quarterfinals exit; 2022/23: champion), although the YOY reduction for the UEFA component is softened by incremental Super Cup income in 2023/24.
Domestic broadcast income was likely ~ flat YOY given that City won the PL title each season, but the non-UEFA component indicatively also includes ~ £3.9m in revenue from City’s participation in the Club World Cup.
Revenue Segment: Matchday
Matchday revenue increased from £71.9m to £75.6m (+5.1%) despite four fewer paid home matches and one less neutral venue match.
As an aside, the club’s strategic report states that City played 31 home matches in 2022/23 (and therefore 5 fewer home matches), but by my count the 2022/23 total is 30 (PL: 19; UCL: 6; FA Cup: 3; EFL Cup: 2).
Adjusted EBITDA
Earnings before interest, tax, depreciation, and amortization (EBITDA) is generally viewed as a proxy for cash profit. Note that EBITDA in this analysis is presented on an adjusted basis that excludes profit from fixed asset sales, which is deemed a non-core activity (note that adj EBITDA also excludes exceptional items, but City have no exceptional income or expenses over the past decade).
Manchester City generated adj EBITDA of £117.2m in 2023/24, representing 16.4% of revenue. Both adj EBITDA and adj EBITDA margin have edged down since 2021/22, with EBITDA margin the second-lowest of the past decade (and lowest in a non-Covid-impact period). With that said, an adj EBITDA margin of 16.4% is deemed strong by broader industry standards.
While Manchester City’s 2023/24 adj EBITDA was highest among the Big 6 cohort from 2020-2022, the club ranked third within the peer group in 2022/23 and between second and fourth from 2013-2019. Based on (i) Manchester United’s figure already exceeding City’s and (ii) Liverpool’s and Chelsea’s (at minimum) likely to fall below City’s, I expect City will fall between second and fourth for 2023/24 as well.
Manchester City’s total wage bill decreased by £10.3m (2.4%) from £422.9m to £412.6m, likely due to lower variable player bonuses versus the 2022/23 side that won a more prestigious mix of trophies.
The club’s wages-to-revenue ratio edged down from 59.3% to 57.7%, reflecting the modest wage decrease and slight revenue increase. The ratio is deemed healthy and is likely to be on the stronger side among PL clubs for 2023/24 (note: only 6 of 20 PL clubs managed a sub-60.0% ratio in 2022/23).
Manchester City’s 2023/24 total wage bill exceeds Manchester United’s by £47.9m (13.1%), which is narrower than the difference in 2022/23 (£91.5m) when United competed in the UEL.
Barring a major surprise, City’s 2023/24 wage expense will top the PL for the second consecutive year.
Other operating expenses (OOEs) include, but aren’t limited to, costs associated with staging matches and other events (e.g. concerts), commercial operations, property and equipment maintenance, utilities, transportation & accommodations, and professional advisory services (legal, consultancy, etc).
Manchester City’s OOEs increased by £17.4m (10.1%) from £172.2m to £189.7m, despite the likelihood that staging costs declined YOY (four fewer home matches; five fewer concerts). MCFC’s accounts provide very little granularity for this cost category (standard for PL clubs), but a known minor factor for the increase is YOY growth in cost of sales from £15.6m to £17.2m (+£1.6m). Other factors driving the increase are likely to include increased legal costs stemming from legal disputes with the PL.
As a percentage of revenue, Manchester City’s OOEs increased from 24.2% to 26.5%, representing the highest figure over the past decade excluding Covid-impacted 2019/20. Note that the OOE-to-revenue ratio falls to 25.9% when incorporating non-core income generated from the Elite Player Performance Plan initiative and compensation from UEFA and FIFA for releasing players to their national teams as a partial offset.
Adjusted EBIT
Adjusted earnings before interest and taxes (EBIT), which also excludes fixed asset sale profits and exceptional items, is considered a proxy for day-to-day profit/(loss).
Manchester City’s 2023/24 adj EBIT reflects a loss of £60.5m (note: YOY loss widening of £26.1m), which is the eighth consecutive year of day-to-day operating losses and largest of the past decade in a non-Covid-impacted period. Note that the vast majority of football clubs tend to have negative adj EBIT, with Brentford the only PL club to realize a day-to-day profit in 2022/23.
The £26.1m YOY reduction in adj EBIT reflects a £5.9m decline in adj EBITDA and £20.2m increase in non-cash-flow expenses, primarily in the form of increased player amortization expense (+£19.6m).
For a more complete view of player-related expenses, a commonly evaluated industry ratio is total wages plus player amortization to revenue (note: for PL clubs the ratio includes non-player wages due to lack of reporting segmentation).
Manchester City’s 2023/24 wage plus player amortization of 80.8% is strongly in line with the range of 78.8% to 82.6% exhibited since 2016/17 for non-Covid-impacted years (i.e. excluding 2019-2021).
Pre-Tax Profit
While Pre-tax (and post-tax) profit decreased by £6.6m from £80.4m to £73.8m, the result is very strong by industry standards and represents the fourth straight period with an overall profit (and third straight with a relatively substantial overall profit). For comparison, only four PL clubs (Brighton, Manchester City, Bournemouth, and Brentford) realized a pre-tax profit in 2022/23, with one (Bournemouth) relying on sizeable exceptional other operating income from extinguishment of a shareholder loan.
Manchester City’s 2023/24 pre-tax result means the club has now made a cumulative pre-tax profit of £126.2m since 2014, which is only bettered by Liverpool (£193.3m) over the period (note: LFC is expected to post a pre-tax loss in 2023/24 that would materially narrow the difference).
More notably, Manchester City has been the only club among the Big 6 cohort to demonstrate improved profitability post-Covid-impact (2021 to latest) compared to the five-year period preceding Covid impact (2014-2019).
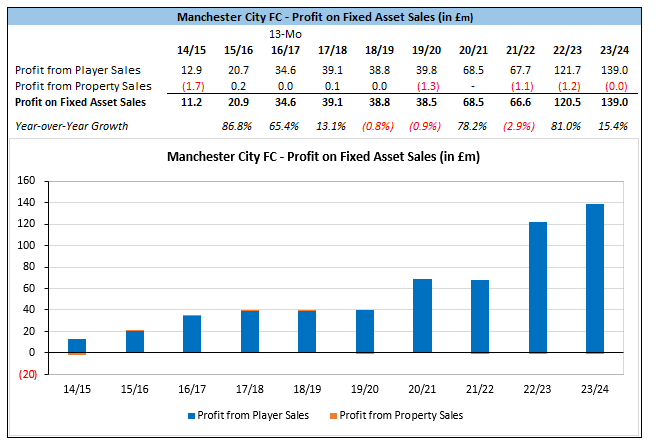
Generation of player sale profit has been a key element of Manchester City’s strategy in recent years, with player sale profit totaling £259.5m across the past two years and £394.6m across the past four years.
Manchester City’s substantially improved player sale profit since 2019/2020 has resulted in notable separation from each Big 6 club except Chelsea, who pre-dated City with respect to generating substantial profit from expansive academy operations.
Note on Compliance with PL and UEFA Regulations
Manchester City are required to demonstrate compliance with two sets of financial regulatory tests:
P&L Profitability and Sustainability Rules (PSR).
UEFA Financial Sustainability Regulations (FSR), comprised of a break-even rule, squad cost rule (SCR), positive net equity test (note: MCFC have the largest positive net equity among UEFA clubs), and overdue payables test 3x annually (note: Manchester United’s accounts stated this has increased to 4x annually).
With respect to FSR (two-year test period) and PSR (three-year test period), based on MCFC’s aggregate pre-tax profit of £154.1m across 2022-2024 and £195.1m across 2021-202, there is sizeable cushion against permissible loss thresholds for respective tests (even before considering permissible add-backs).
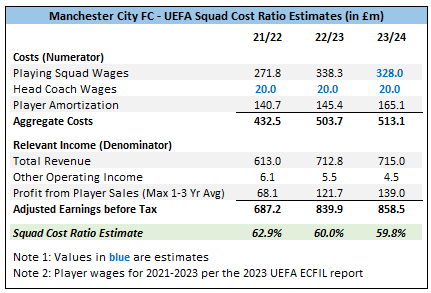
With respect to the SCR evaluation, my estimates have MCFC well within the 70.0% long-term maximum threshold.
Section 2 - Fixed Asset Investment
Manchester City’s net fixed asset spend of £128.0m in 2023/24 encompasses net spend related to player registrations of £58.0m and net infrastructure spend of £69.9m. Note that figures cited are based on net cost rather than net cash spend.
The figure for 2023/24 is directly in line with the ten-year (2014-2024) average of £127.7m, but the subject year is the first since 2014/15 where net infrastructure spend exceeded net player spend.
Investment in Player Registrations
The £58.0m net spend associated with player registrations reflects:
Gross spend of £226.4m, driven by the signings of Joško Gvardiol from RB Leipzig, Jérémy Doku from Rennes, Matheus Nunes from Wolves, and Mateo Kovačić from Chelsea.
Net fee income from player sales of £168.4m, primarily through the sales of Riyad Mahrez to Al-Ahli, Cole Palmer to Chelsea, Aymeric Laporte to Al-Nassr, James Trafford to Burnley, and, indicatively, Taylor Harwood-Bellis to Southampton.
While the transfer of Harwood-Bellis was announced as completed on 01 July 2024 (first day of the 2024/25 financial period), the transaction is not listed among sales after the 30 June 2024 reporting date, indicating likely recognition in the 2023/24 period.
Manchester City’s 2023/24 net spend was £115.3m below Manchester United’s figure, representing the third consecutive year with a notably lower net outlay than their local rivals.
That trend is on course to continue for 2024/25, with MUFC posting a net spend of £167.6m in 1Q 2024/25 versus MCFC disclosing net income of £92.8m from transfer activity during the subsequent event period in accounts (roughly the first three months). However, given City’s sporting struggles to date in 2024/25, it wouldn’t be surprising if the club narrowed the present-year gap via squad investment in the January 2025 transfer window.
Manchester City’s squad costs edged down slightly from £1,117.5m to £1,110.3m (YOY: -£7.2; -0.6%), with the total cost of disposed registrations (£233.5m) exceeding gross spend (£226.4m) during the period. The high total cost of disposals (as of registration disposal dates) is driven by departures of Riyad Mahrez, Aymeric Laporte, İlkay Gündoğan, and Benjamin Mendy.
MCFC’s squad cost has been the highest among the Big 6 cohort (and therefore highest among PL clubs) since 2016, but it is likely that Chelsea’s squad cost as of 30 June 2024 will exceed Manchester City’s given the scale of the Blue’s transfer spend in 2023/24.
Investment in Physical Assets
Manchester City’s infrastructure net spend of £69.9m in 2023/24 represents a £49.2m YOY increase, driven by Etihad Stadium redevelopment that will see capacity increase by ~ 8k to 62k at a projected total cost of £300.0m. The club disclosed capex commitments contracted but not provided for of £169.3m as of end-Jun ’24, indicating that infrastructure spend is likely to climb further in 2024/25.
Section 3 - Cash Flow Statement
Manchester City doesn’t provide a cash flow statement in its published financial results, with the club taking advantage of a permitted disclosure exemption under FRS 101 (a cash flow statement is included in The City Football Group Limited’s financial results, which will likely be published in late March / early April 2025).
However, despite the absence of the statement (and lack of granularity to precisely derive), there is sufficient detail to get reasonably close to actuals for cash flow from operations, cash flow from investing, and cash flow from financing.
Cash flow estimates for 2023/24 are summarized below:
Cash flow from operations (CFO) declined by ~ £66.5m from ~ £95.1m to ~ £28.7m, primarily attributable to an ~ £64.3m increase in working capital consumption from ~ £22.3m to ~ £86.6m (note: deferred income decreased YOY by £104.5m).
Cash flow from investing (CFI) was an outflow of ~ £54.2m, representing an ~ £39.5m (42.2%) YOY reduction in cash investment spend.
It is noteworthy that the net cash player outlay swung from an ~ £72.9m outflow to an ~ £15.8m inflow, driving the reduced net investment outlay despite an increase in net capex from ~ £20.7m to ~ £69.9m (~ +£49.2m).
Cash flow from financing remained ~ nil as the club did not issue equity in exchange for cash or borrow (owner or external) during the period.
Cash reserves (note: actual) decreased by £25.5m from £79.3m to £53.8m, reflecting the aggregate impact of CFO, CFI, and CFF.
Section 4 - Debt Measures
This section discusses (i) financial debt, (ii) transfer debt, and (iii) and football net debt.
Financial Debt
Manchester City’s gross financial debt of £63.3m at end-Jun ‘24 is related to the club’s 250-year lease with the Manchester City Council. On a net-of-cash basis, debt stood at only £9.6m (compared to £473.1m for local rivals Manchester United as of the same date).
While it is noted that Manchester City have been generally self-sufficient over the past ~ 9 years, the club’s lack of financial debt is largely due to more than £1.3bn in owner funding provided to the club since the September 2008 acquisition by Sheikh Mansour bin Zayed Al Nahyan (note: nearly 94% of total owner funding was provided from 2008 to 2015).
Transfer Debt
Manchester City’s gross transfer debt increased from £204.4m to £229.9m (+£25.6m), reflecting a £38.9m decrease in payables due within 12 months and £64.4m increase in the portion due in greater than one year. Indicatively, City were able to negotiate favorable financing terms for various player acquisitions during the period.
While payables increased YOY, transfer receivables decreased by £48.2m from £120.2m to £168.4m (note: receivables within one year decreased modestly from £80.9m to £75.1m). The reduction despite notable sales indicates generally beneficial finance terms to City on the selling side as well, likely stemming from sales of Mahrez and Laporte to (cash-flow-insensitive) clubs in Saudi Arabia.
With transfer payables increasing by £25.6m and transfer receivables decreasing by £48.2m, Manchester City’s net transfer debt overall increased by £73.8m to £109.8m as of end-Jun ‘24. While total net transfer debt notably increased, the portion due within one year decreased by £33.1m to £24.7m.
Manchester City’s net transfer debt tends to be on the low side among the Big 6 cohort, and despite the YOY increase it is likely to remain as such as of end-2023/24 once the remaining four have published financials.
Football Net Debt
Football net debt is an industry-specific figure that aggregates net financial debt and net transfer debt to provide a more complete view of football clubs’ debt obligations.
Aggregating component figures for MCFC results in football net debt of £119.4m, which increased YOY by £98.8m but remains modest when considering the club’s resources (owner strength; ability to generate funds from core operations and player sales).
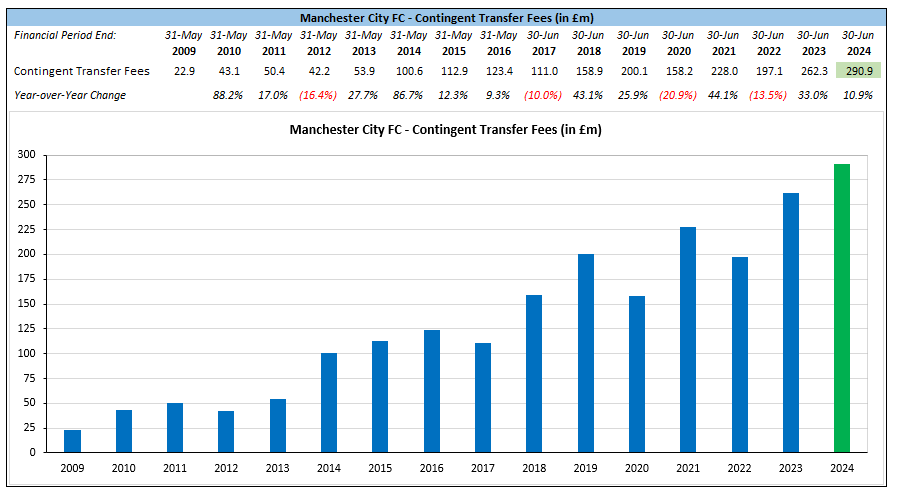
Manchester City’s contingent liabilities related to transfer fees increased from £262.3m to £290.9m (+£28.7m; +10.9%), which is considerably higher than contingent transfer payables for other PL clubs. However, given the club’s low net football debt, capacity of ownership to supply funding if needed, and positive correlation between sporting success (driving higher income) and crystallization of contingent payables, these potential obligations aren’t a threat to the club’s financial well-being.
Conclusion
Manchester City continue to exhibit a very robust financial profile, with the club (i) once again posting record revenue for a PL club, (ii) delivering strong adj EBITDA and pre-tax profit, and (iii) carrying very modest net football debt. Further, the club’s ownership has demonstrated capacity and willingness to inject significant capital in the past in pursuit of sporting objectives.
These financial characteristics indicate significant capacity for player investment, even in the midst of a major capital project with significant funding demands. And, given the club’s recent dire form on the pitch (1W 2D 8L over the past 11 matches across competitions), this capacity may be tapped sooner rather than later to facilitate a squad rebuild.
Perhaps as soon as January, despite the club’s general aversion to major transfer activity in the mid-season window.


