


Newcastle United: 2023/24 Financial Results
Overview of P&L, Investment, Cash Flow, and Debt

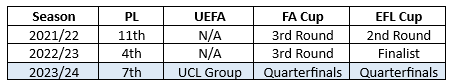
This entry reviews Newcastle United’s 2023/24 financial results, which encompass a period when the Magpies finished 7th in the Premier League (PL), were eliminated from the UEFA Champions League (UCL) in the group stage, and reached the quarterfinals of both domestic cup competitions.
The review will cover the following dimensions:
Profit and loss account statement;
Fixed asset investment (player and infrastructure);
Cash flow statement;
Financial debt and transfer debt.
Legal Entity Reviewed
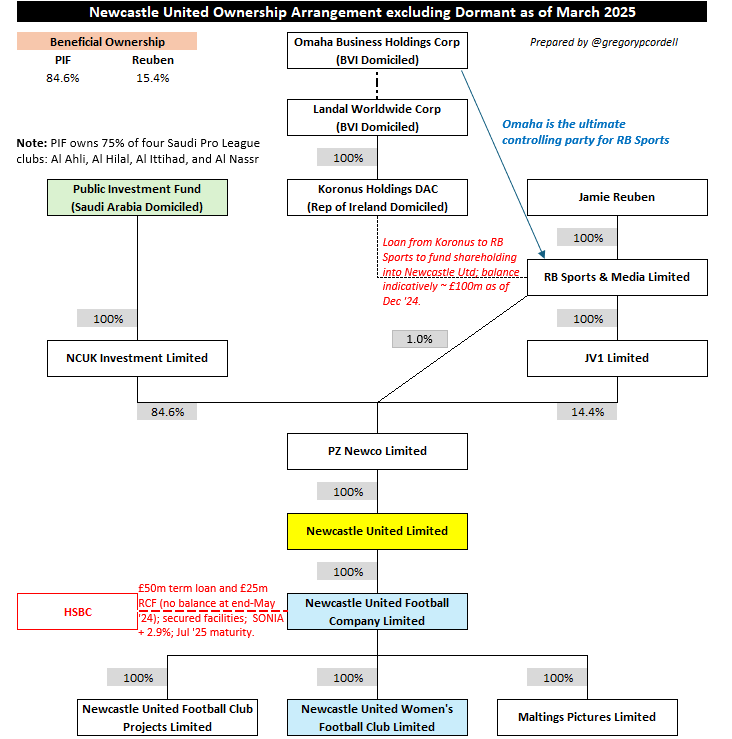
The interchangeable references to Newcastle United, Newcastle, or NUFC in this post refer to Newcastle United Limited, a UK-incorporated holding company that directly owns 100% of share capital of the men’s football club and indirectly owns 100% of the women’s football club (reviewed: yellow; football clubs: blue; control party: green).
Note that the diagram below reflects the current ownership arrangement rather than the outlay at end-Jun ’24 (financial period end), when the beneficial ownership split entailed Saudi Arabia’s Public Investment Fund (PIF) with 80.0%, Jamie Reuben with 14.3%, and Amanda Staveley with 5.7%, who exited the ownership group in Jul ’24.
Section 1: Profit/(Loss) Statement
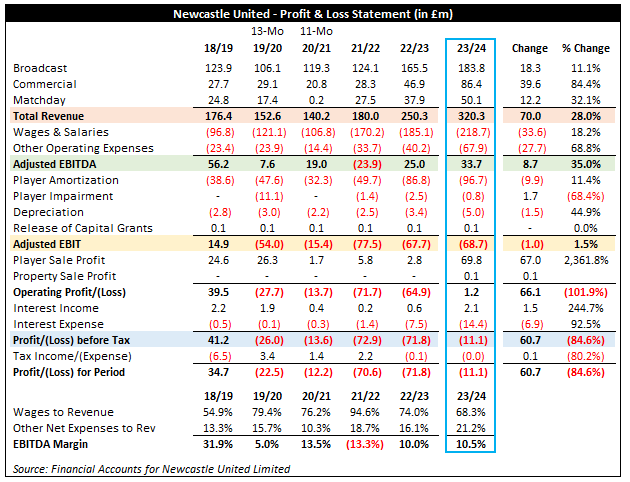
Newcastle’s revenue and key profitability metrics are summarized below:
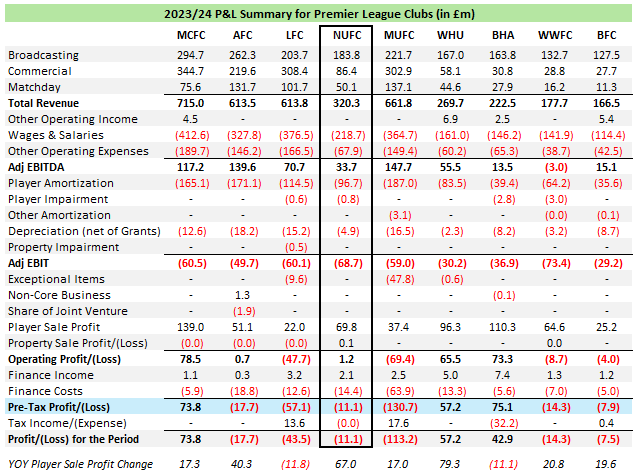
Revenue increased by £70.0m (28.0%) to £320.3m, reflecting robust year-over-year (YOY) growth each core revenue segment (commercial: +£39.6m; broadcast: +£18.3m; matchday: +£12.2m).
Adjusted EBITDA increased by £8.7m (35.0%) to £33.7m, attributable to revenue growth versus a £61.3m increase in cash expenses (wages: +£33.6m; other: +£27.7m).
Adjusted EBIT worsened by £1.0m to a loss of £68.7m, reflecting a £9.7m increase in non-cash-flow expenses (player amortization & impairment: +£8.2m; depreciation: +£1.5m) that slightly exceeded the YOY improvement in adjusted EBITDA.
Pre-tax profit of £11.1m, representing a £60.7m YOY improvement driven a sizeable increase in player sale profit (+£67.0m) and slight increase in property sale profit (+£0.1m), partially offset by higher net finance costs (+£5.4m) and lower adjusted EBIT.
Total Revenue
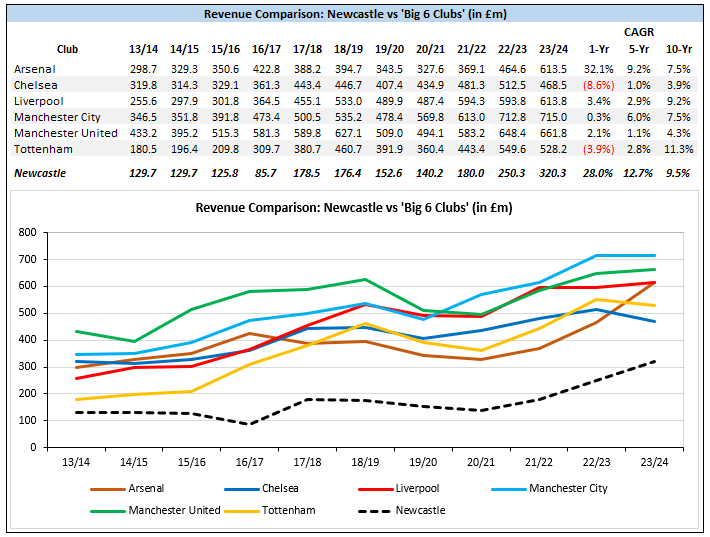
Newcastle’s total revenue of £320.3m during 2023/24 is 78.0% higher than revenue of £140m generated in 2021/22, representing a 33.4% compound annual growth rate (CAGR) over the two full annual periods to date in which Saudi Arabia’s Public Investment Fund (PIF) has been NUFC’s ultimate controlling party.
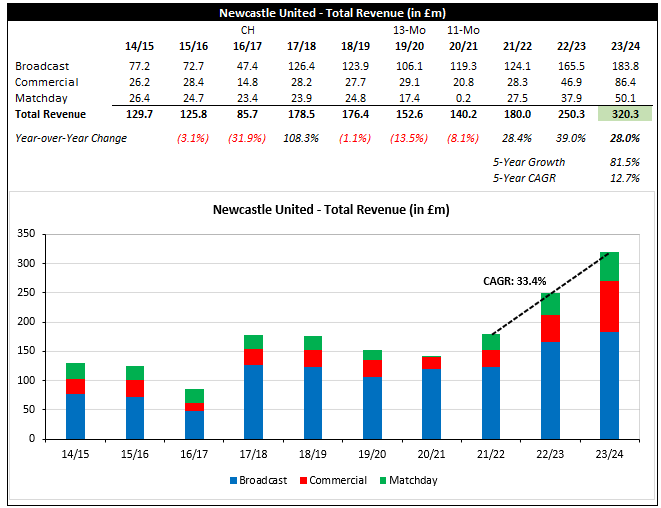
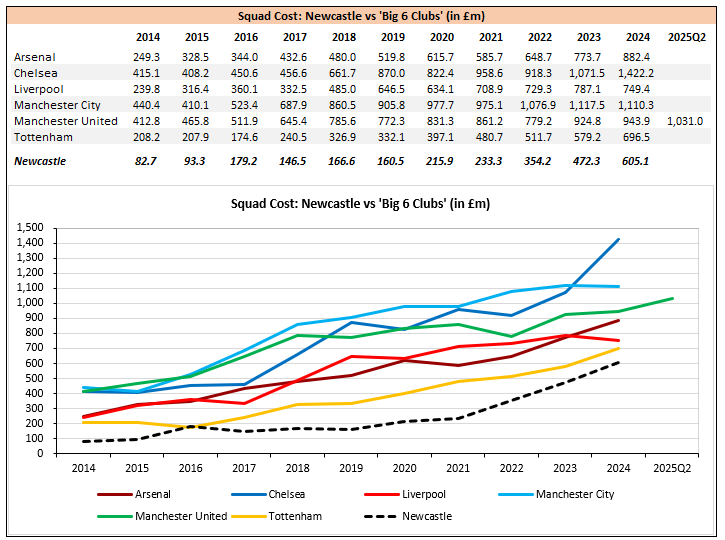
As a result of supercharged growth over the past two years, Newcastle’s revenue has gone from effectively the PL median in 2021/22 to 56.0% above the league median in 2023/24.
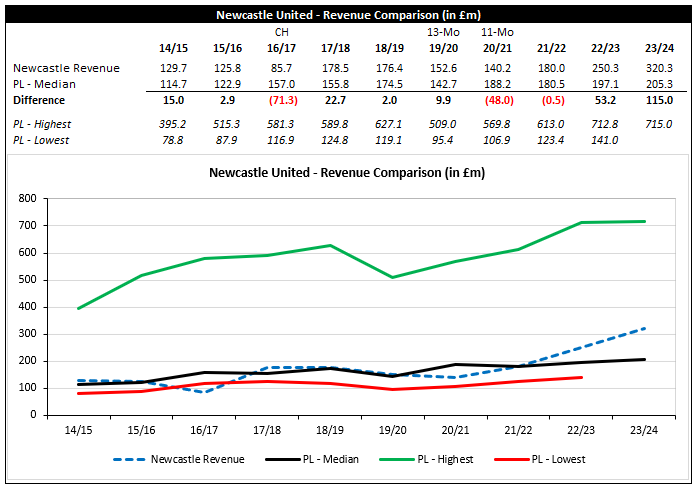
While NUFC have separated from the league median and are the first club outside of the ‘Big 6’ to generate revenue greater than £300.0m in a year, the club’s revenue for 2023/24 was 31.6% below Chelsea’s and 39.4% below Spurs’ during a period when neither London-based club competed in Europe.
Given current (and pro-forma) financial regulations enforced by the PL and UEFA that, all else equal, benefit clubs that generate higher income, this gap represents a near-term challenge for Newcastle despite the vast financial resources of the club’s ownership (albeit a challenge on course to be overcome in the mid- to long-term based on the current club’s current trajectory).
Revenue Segment: Broadcast
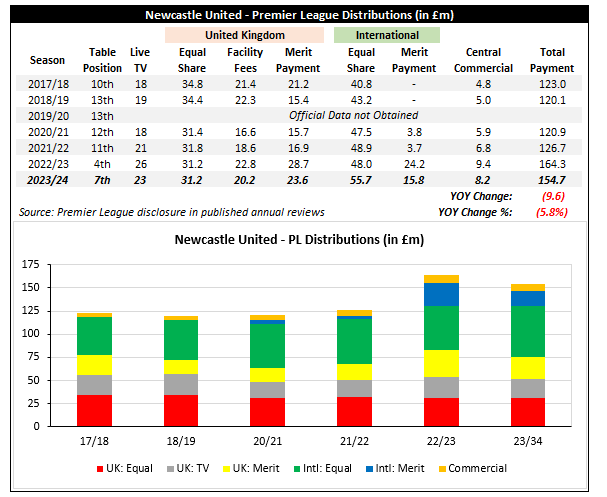
Newcastle’s broadcast revenue increased by £18.3m (11.1%) to £183.8m, reflecting distributions of £29.8m from UCL participation (note: no UEFA income in 2022/23) versus an £11.5m (7.0%) decrease from domestic television and broadcasting revenue (PL; domestic cups; local radio).
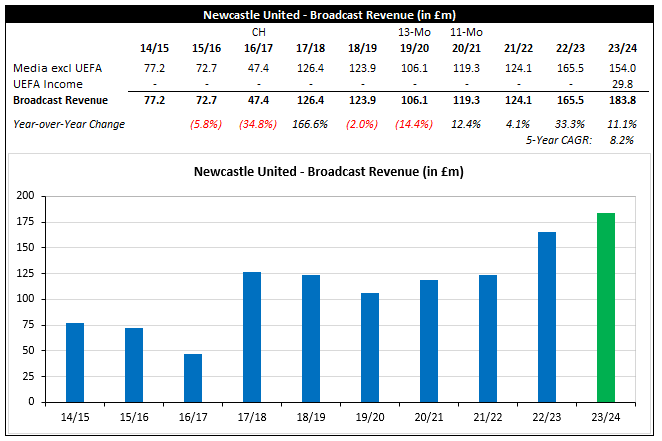
The primary driver for the £11.5m reduction in domestic broadcast revenue are lower PL distributions (-£9.6m overall; -£8.4m excluding central commercial), resulting from finishing three places lower in the league table, three fewer live TV appearances, and slight adverse impact from a higher proportion of PL distributions (overall) aligned to equal share components.
Newcastle’s 2024/25 broadcast revenue will be lower due to lack of European football. However, stronger placement in the league in 2024/25 would soften the decrease somewhat and, more importantly, clinch European qualification for 2025/26 (with 5th place sufficient for UCL qualification this season).
As of writing NUFC sit in 9th place (note: 7th on points per match) in the table so there is considerable work to do, but the table from 4th to 10th is congested and Newcastle are only 3 points behind 5th-placed Manchester City with a match in hand.
Revenue Segment: Commercial
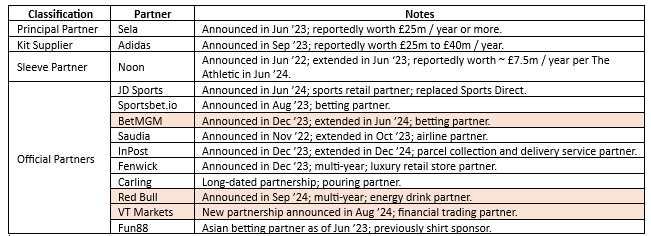
Newcastle’s extraordinary YOY commercial growth of £39.6m (+84.4%) is primarily driven by sponsorship growth through (i) new deals with shirt partner Sela and kit supplier Adidas, (ii) an upsized deal with Noon in conjunction with elevation to sleeve partner, and (iii) a mix of new and upsized deals with various secondary partners to include, but not limited to, InPost and Fenwick.
The contribution from related parties Sela and Noon (also under PIF ownership) was particularly noteworthy, as revenue derived from related parties increased YOY by £22.3m to £29.0m per disclosure in notes to the accounts.
Other growth drivers cited by the club include the release of the We Are Newcastle United documentary on Amazon Prime and improvements to retail and catering activities.
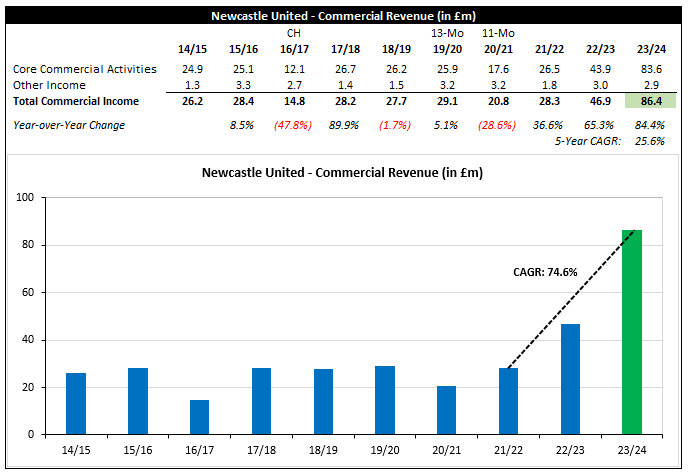
While the pace of commercial revenue growth is likely to be lower in 2024/25, further commercial gains are anticipated in 2024/25 based on (i) new sponsorship deals with VT Markets, Red Bull, and BetMGM (note: the strategic report cites Bet365, but the club’s website lists BetMGM as betting partner) and (ii) improved retail operations.
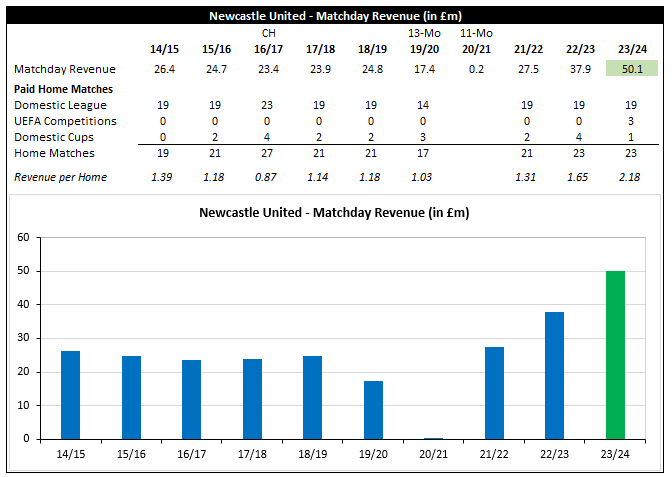
Revenue Segment: Matchday
Matchday revenue increased by £12.2m to £50.1m despite the same number of staged home matches, partially driven by the stronger mix of non-PL matches (3 UCL in place of domestic cups) and higher season ticket prices (+3.3% YOY blended average per a Jun ’23 club announcement).
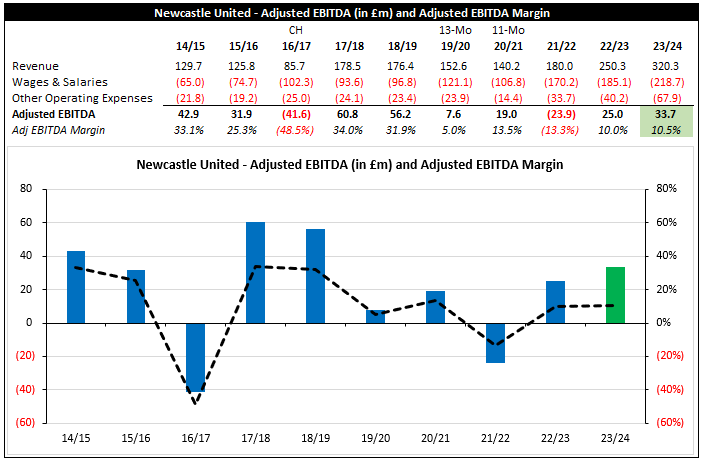
Adjusted EBITDA
Adjusted earnings before interest, tax, depreciation and amortization (adj EBITDA) is generally viewed as a proxy for recurring cash profit.
Newcastle’s revenue grew faster than cash expenses YOY on both an absolute basis (revenue: +£70.0m; cash expenses: +£61.3m) and relative basis (revenue: +28.0%; cash expenses: +27.2%), resulting in improvement in both adj EBITDA (+£8.7m) and adj EBITDA margin (+0.5%).
NUFC’s adj EBITDA and margin are each 6th highest among the 9 clubs to publish 2023/24 result thus far, although the composition of ‘early’ reporters slants towards sides with stronger cash profit. Once all clubs have reported I expect NUFC’s cash profit metrics to be slightly stronger than league-wide medians.
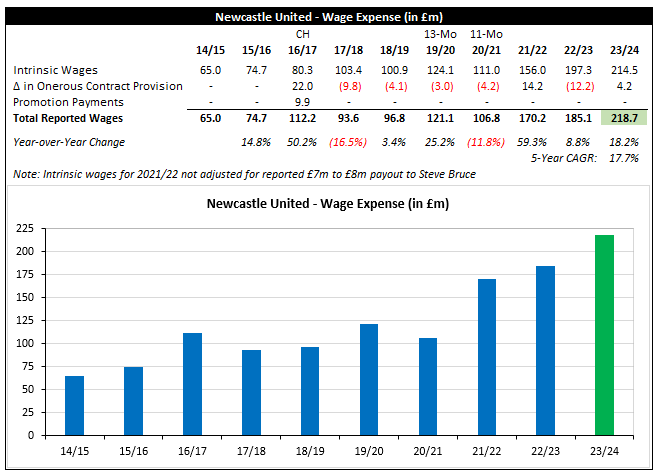
Newcastle’s total wage bill increased by £33.6m (18.2%) to £218.7m, (i) representing the primary driver of the £61.3m total increase in cash operating expenses and (ii) attributable to:
Increased first team wages resulting from (i) summer 2023 squad changes and (ii) intra-period contract modifications for Bruno Guimarães (Oct ’23), Fabian Schär (Jan ’24), and Joelinton (Apr ’24),
Increased compensation for key management personnel (+£3.4m YOY to £6.9m), and
General expansion of club operations that saw total headcount increase by 115 (28.0%) to 525, including an increase in business operations personnel by 73 (36.5%) to 273.
As a technical note, YOY wage growth was less severe (+8.7%) when adjusting for the £16.4m adverse swing in onerous contract provisions during the period.
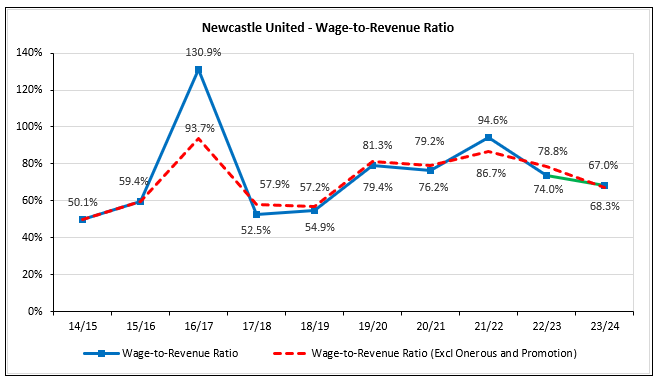
Due to YOY revenue growth (+28.0%) outpacing wage bill growth (+18.2%), NUFC’s wage-to-revenue ratio decreased from 74.0% to 68.3% (intrinsic only: 78.8% to 67.0%).
The ratio is currently 3rd highest among the 9 PL clubs to publish 2023/24 results thus far, but it is expected to be better (lower) than the league-wide median once all clubs have released financials.
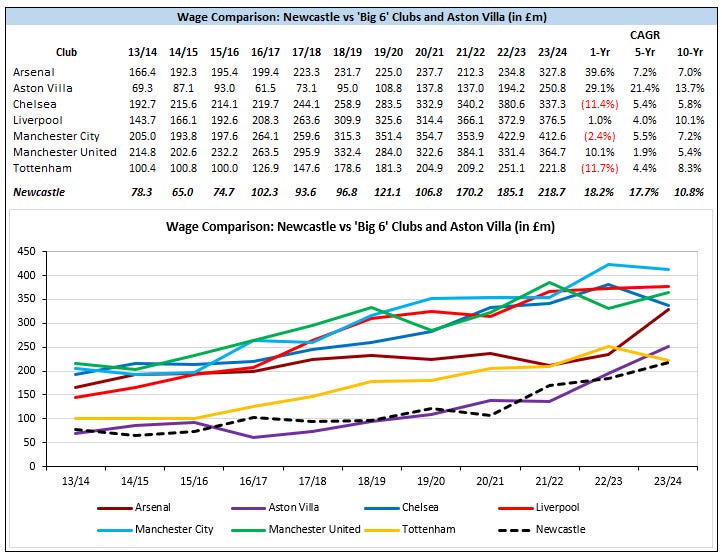
Newcastle’s total wage bill for 2023/24 is 8th highest among PL clubs, behind each club in the Big 6 cohort (albeit very narrowly below Spurs’) and fellow ascendant club Aston Villa.
While Newcastle have nearly ‘caught up’ to Spurs with respect to wages, it is noted that the other Big 6 clubs had wage bills that were 49.9% (Arsenal) to 88.6% (Man City) higher than Newcastle’s, illustrating the substantial gap that remains to those 5 domestic rivals in spite of Newcastle’s sizeable recent player investment.
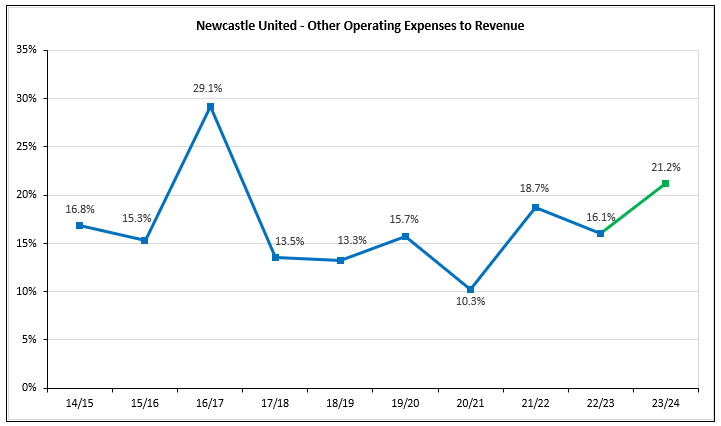
Other operating expenses (OOEs) include, but aren’t limited to, costs associated with staging matches, commercial operations, property and equipment maintenance, utilities, transportation & accommodations, and professional advisory services (legal, consultancy, etc).
Newcastle’s OOEs increased very sharply from £40.2m to £67.9m (+£27.7m; +68.8%).
While very little visibility is provided for this expense category (standard for PL clubs), the club cites (i) variable costs associated with matchday and commercial revenue growth and (ii) the development of departments across the club as key drivers.
Beyond those elements, it wouldn’t be surprising if general inflationary pressures played a part as well. Across the 8 other PL clubs to publish 2023/24 results thus far, OOEs have increased in aggregate by 13.4% YOY, which is in line with matchday growth of 13.2% but comfortably outpacing commercial revenue growth of 9.0%.
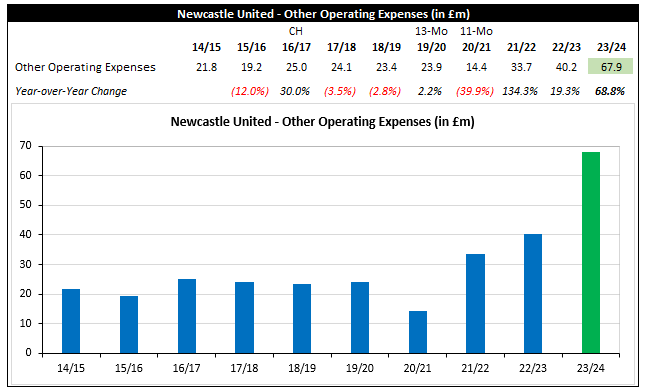
The sharp increase to OOEs saw the cost category as a percentage of revenue jump from 16.1% to 21.2%, which is above the club’s historical norms during years as a PL member club.
With that said, 21.2% is not a bad ratio by PL club standards as the 8 other clubs to publish 2023/24 results have exhibited ratios ranging from 21.8% to 29.4% (median: 24.7%).
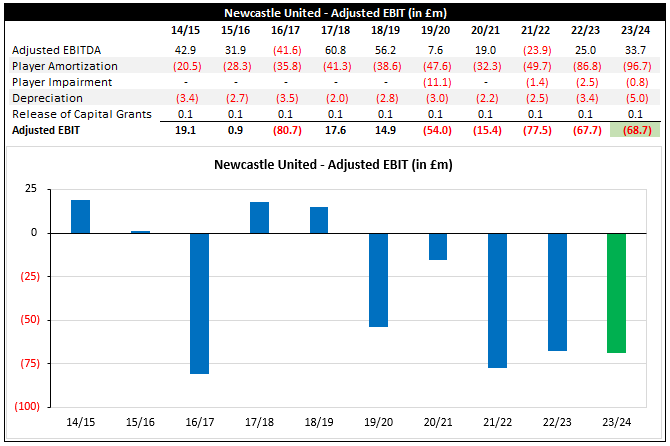
Adjusted EBIT
Adjusted earnings before interest and taxes (adj EBIT) is generally viewed as a proxy for recurring day-to-day profit/(loss).
Newcastle’s adj EBIT of negative £68.7m takes the aggregate day-to-day loss to £213.9m across 2021-2024 (average: £71.3m).
While this result is somewhat typical for PL clubs – the median 2023/24 result across the 9 clubs to publish thus far is a £59.0m – recurring deep day-to-day losses invariably put pressure on clubs to generate profits from fixed asset sales (player sales; property sales where not restricted) to meet in-force financial regulatory requirements.
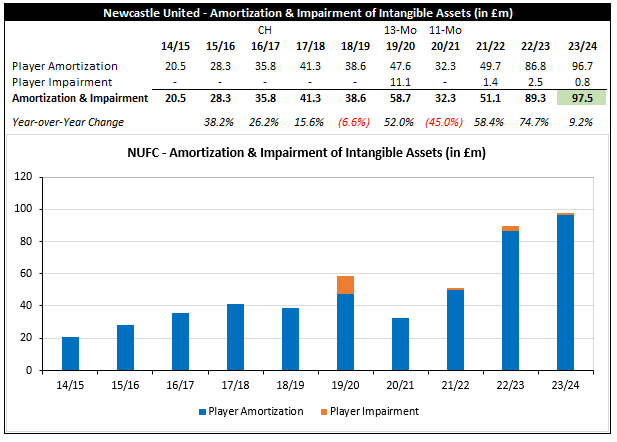
Newcastle’s player amortization expense increased YOY by £9.9m (11.4%) to £96.7m, driven by summer 2023 player recruitment and full-year impact from acquisitions during the Jan ’23 transfer window.
Viewing player amortization and impairment in aggregate, the YOY increase was slightly milder (+£8.2m; +9.2%) due to a lower impairment charge during the period.
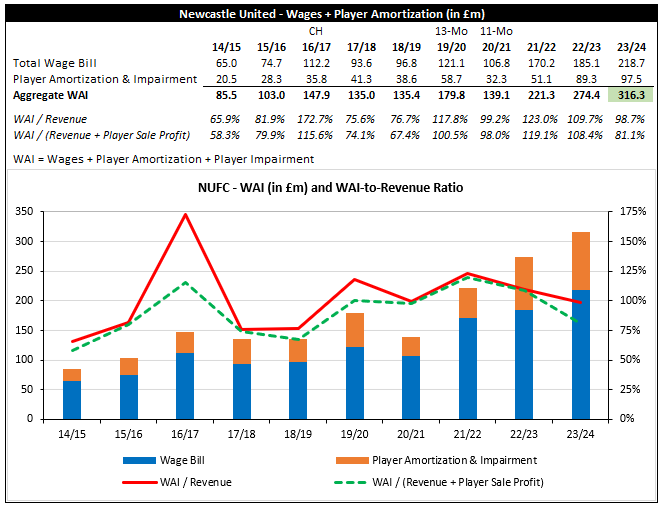
To more completely assess player-related expenses, a commonly evaluated industry ratio is total wages plus player amortization & impairment (WAI) to revenue (note: for PL clubs the ratio includes non-player wages due to lack of reporting segmentation).
Newcastle United’s WAI-to-revenue ratio decreased (improved) YOY from 109.7% to 98.7% due to revenue growth (28.0%) exceeding WAI growth (15.2%).
While the metric exhibited YOY improvement and dipped below 100.0% for the first time since 2020/21, the ratio is relatively high by PL standards. The only 2023/24 reporting club to date to exceed NUFC’s is Wolves (117.7%), with the other 7 exhibiting ratios from 80.1% (Liverpool) to 90.6% (West Ham).
Pre-Tax Profit/(Loss)
Newcastle’s pre-tax loss of £11.1m for 2023/24 represents a significant improvement versus pre-tax results for 2021/22 and 2022/23, driven by vastly improved player sale profit dictated by the need to comply with PL financial regulations (see note on regulatory compliance further below).
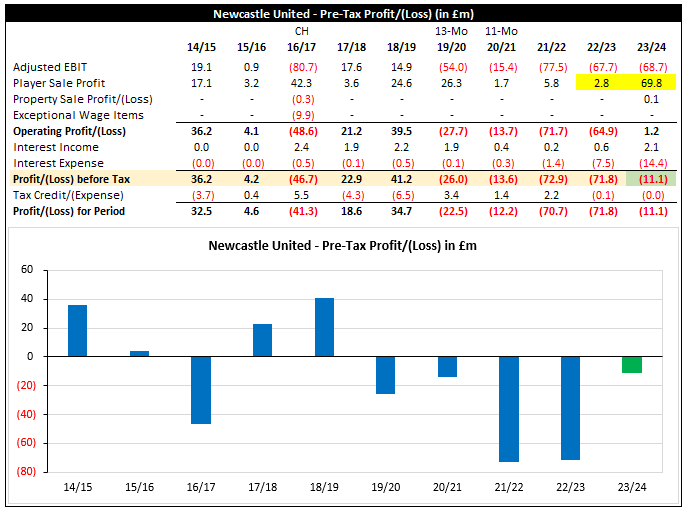
Newcastle’s pre-tax result for 2023/24 represents the median across the 9 clubs to publish results to date, and I suspect the result will be slightly better than the median once all clubs have reported (note: the club’s 2022/23 pre-tax result was £30.4m worse than the league-wide median).
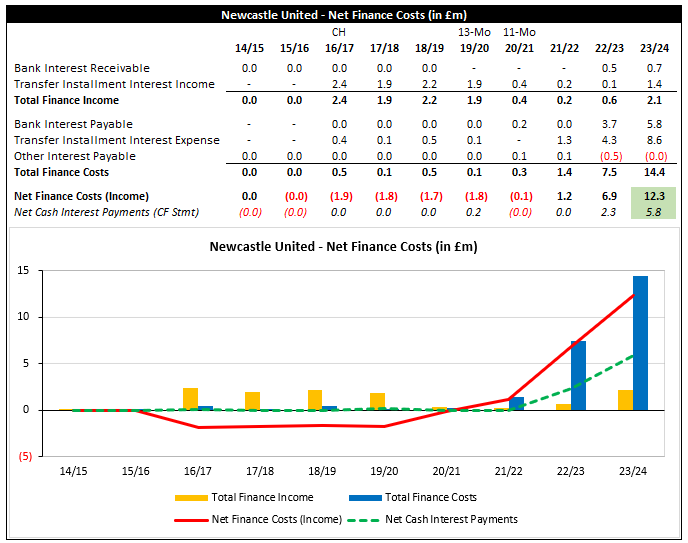
With respect to finance costs, note that the majority of the £12.3m net interest expense is associated with notional interest arising from the unwinding of discounts on transfer installments. While net cash interest payments did increase during the period by £3.5m (higher rates; higher average usage) to £5.8m, they were materially lower than net interest expense.
Note on Compliance with PL and UEFA Regulations
Newcastle’s challenges with respect to PL Profitability and Sustainability Rules (PSR) compliance are well documented, with The Athletic reporting that the club needed to ‘plug a financial black hole that exceeded £50 million’ in its recap of the frantic final two days of the club’s 2023/24 financial period.
Based on confirmation that no PL clubs were charged with PSR breaches for the 2021-2024 cycle, Newcastle were able to plug that hole and comply with PSR through the sale of Yankuba Minteh to Brighton and academy graduate Elliot Anderson to Nottingham Forest in the final days of the window.
However, there is no doubt that Newcastle cut it close – with my rough estimates putting Newcastle’s adjusted earnings before tax only £1.1m above the applicable threshold (which, if sufficiently accurate, would make the reported ~ £4.0m compensation from Manchester United to hire Dan Ashworth just before financial year end a key transaction as well).
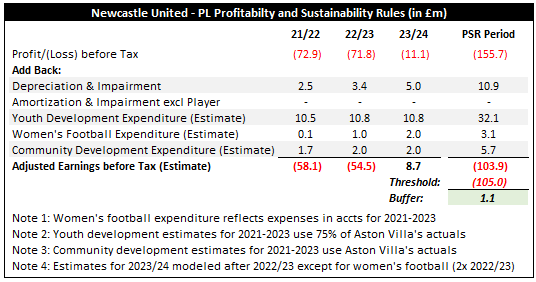
For the 2022-2025 PL PSR cycle, the club will benefit of 2021/22 falling out of the evaluation and the final days of the 2024/25 financial period are unlikely to mimic the frantic final days of 2023/24.
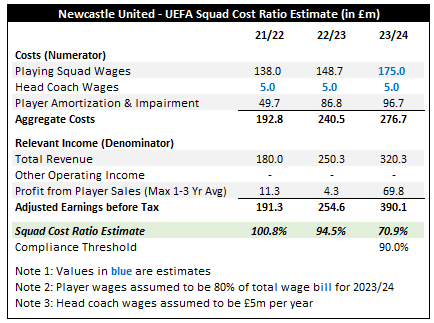
With respect to UEFA Financial Sustainability Regulations, the most noteworthy requirement is the Squad Cost Rule (SCR), which entails a 90.0% threshold for squad costs (player wages and head coaches including exceptional; player amortization and impairment) as a percentage of adjusted revenue (operating income; player sale profit) for 2023/24 that will gradually reduce to 70.0% for 2025/26 and beyond.
Based on my estimates, NUFC’s 2023/24 SCR of ~ 70.9% is indicatively within the 80.0% threshold for 2023/24 but narrowly outside the long-term target threshold.
Section 2 – Fixed Asset Investment
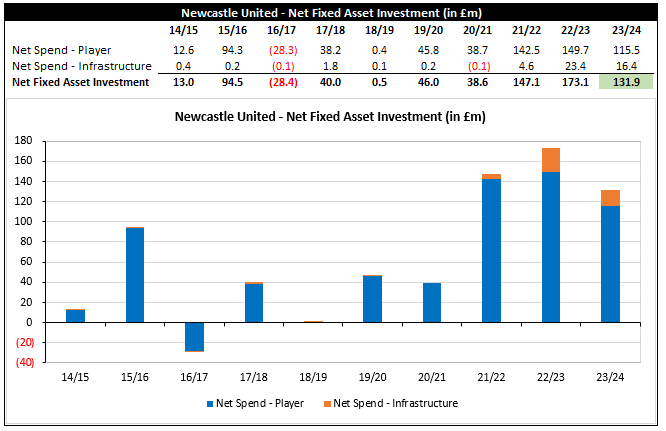
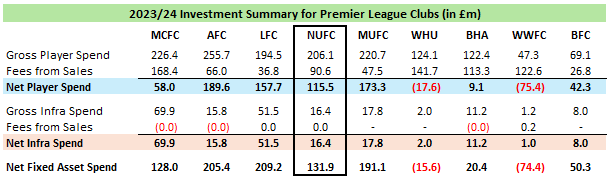
Newcastle’s net fixed asset investment spend decreased by £41.2m (23.8%) to £131.9m, reflecting a player net spend of £115.5m (YOY: -£34.2m; -22.8%) and infrastructure net spend of £16.4m (YOY: -£7.0m; -29.9%).
While net fixed asset spend fell YOY, the outlay (comfortably) exceeded £100.0m for the third straight year and took the three-year total to £452.1m.
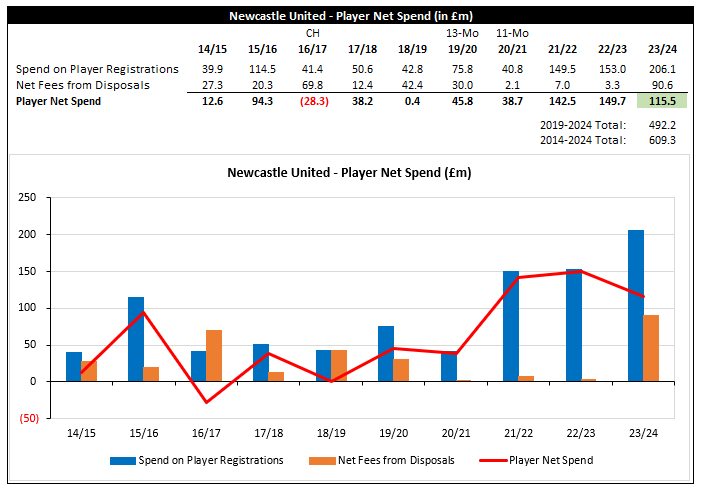
The £115.5m player net spend in 2023/24 reflects:
Gross spend of £206.1m, representing a club record and driven by (i) summer 2023 acquisitions of Sandro Tonali from AC Milan, Harvey Barnes from Leicester City, and Tino Livramento from Southampton, (ii) conversion of Lewis Hall’s loan signing to a permanent deal during the period, and (iii) the acquisition of Odysseas Vlachodimos from Nottingham Forest just before the end of the financial year (30 June 2024), less
Net fee income from sales of £90.6m (also a club record), primarily resulting from (i) the summary 2023 sale of Allan Saint-Maximin to Al-Ahli and (ii) sales of Yankuba Minteh to Brighton and Elliot Anderson to Nottingham Forest on the cusp of financial year end.
With respect to Lewis Hall, it is noted that the club announced the permanent signing on 01 July 2024, which was the first day of the 2024/25 financial period. However, based on the underlying data and the club referencing the addition of Hall as a contributor to increased amortization expense during the period, the mosaic points to recognition as a permanent signing during the 2023/24 financial period.
Newcastle’s player net spend for 2023/24 is currently 4th highest among the 9 PL clubs to report full results to date, although NUFC’s figure is double the outlay for median-club Manchester City (£58.0m).
As a supplemental note, the club disclosed that 2024/25 net spend through accounts sign-off (16 January 2025) was £20m. Given the subsequent (i) permanent sale of Miguel Almirón to Atlanta United and (ii) loan of Lloyd Kelly to Juventus with a conditional purchase obligation deemed so likely to be met that Juventus has classified it as a definitive acquisition, the outlay has likely inflected to a net receivable in the interim.
Newcastle’s squad cost increased from £472.3m to £605.1m (+£132.8m; +28.1%), reflecting gross spend of £206.1m less disposals of player registrations with aggregate accumulated cost of £73.3m.
This latest upward bound represents the third consecutive YOY increase north of £100.0m, resulting in squad cost increasing by 159.4% from end-Jun ’21 to end-Jun ’24 (CAGR: 37.4%).
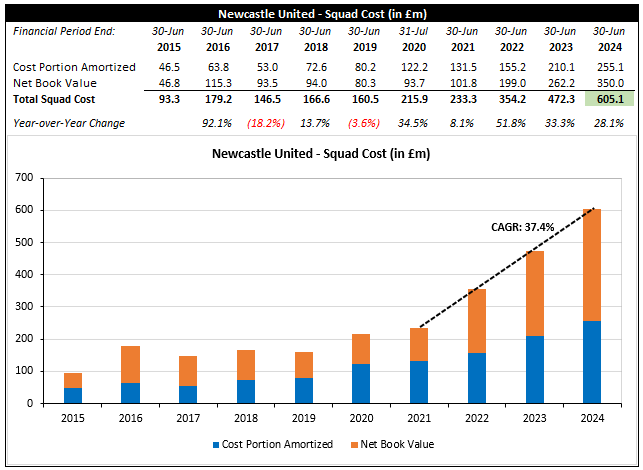
Newcastle’s squad cost was less than half of Tottenham Hotspur’s squad cost as of end-Jun ’21. Despite THFC’s own notable squad cost growth over the most recent three years (CAGR: 13.2%), NUFC’s squad cost narrowed the gap considerably over the period and was only 13.1% lower than THFC’s as of end-Jun ’24.
Section 3 – Cash Flow Statement
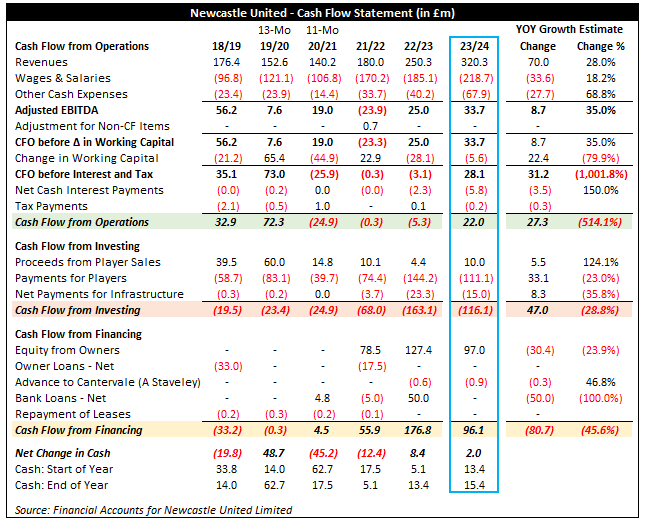
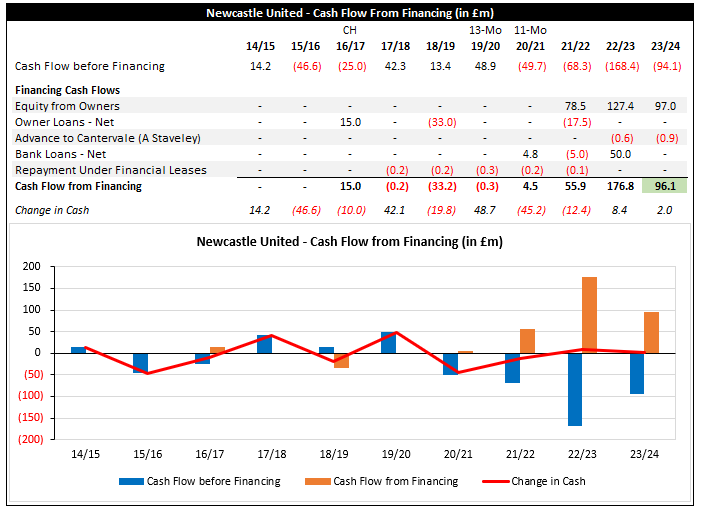
Newcastle’s 2023/24 cash flow statement is summarized below:
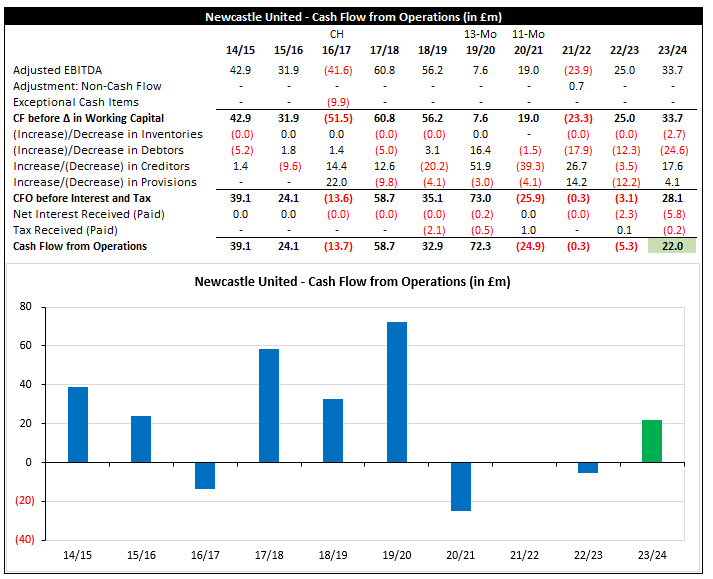
Cash Flow from Operations (CFO) improved by £27.3 to an inflow of £22.0m, driven by the £8.7m improvement in adj EBITDA and a £22.4m decrease in working capital consumption, partially offset by a £3.5m rise in cash interest payments and a £0.3m swing from a small tax receipt in 2022/23 to small tax payment in 2023/24.
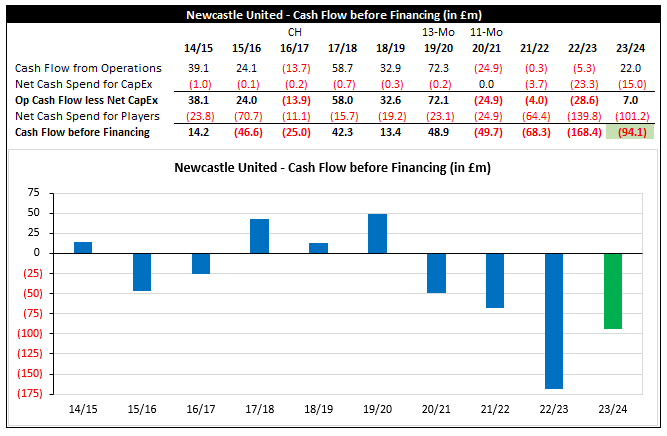
Cash Flow from Investing (CFI) represented an outflow of £116.1m (YOY: lower outflow by £47.0m), reflecting net cash player payments of £101.1m and net capital expenditure (capex) of £15.0m.
Cash Flow from Financing (CFF) entailed an inflow of £96.1m through capital injections of £97.0m from owners (PIF: £77.6m; Reuben: £19.4m; Staveley: £nil) versus a £0.9m to Cantervale Limited (wholly-owned by Amanda Staveley; since renamed to Restart Leisure Ltd and undergoing a voluntary liquidation).
The £96.1m in financing (i) covered the CFO + CFI deficit of £94.0m (CFO: £22.0m; CFI: -£116.1m) and (ii) funded £2.0m in cash to the balance sheet.
Cash Flow from Operations
Newcastle’s operating cash flow of £22.0m reflects adj EBITDA of £33.7m less adverse net working capital movements of £5.6m, net interest paid of £5.8m, and tax payments of £0.2m.
The result represents the first year with positive CFO generation since 2019/20, which was under the highly cash-flow-sensitive stewardship of prior owner Mike Ashley.
Cash Flow from Investing (CFI)
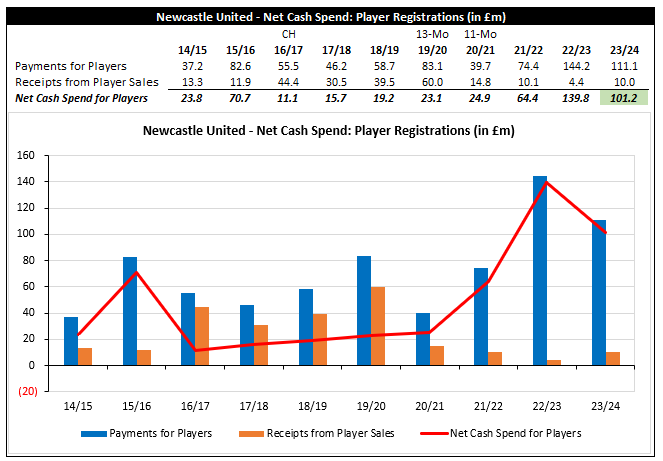
Newcastle’s net cash player spend of £101.2m reflects cash payments for players of £111.1m versus cash receipts from sales of £10.0m. The following is noted with respect to the net cash player outlay:
Gross spend by cost was £206.1m, therefore player payments of £111.1m imply an increase in gross transfer installment payables over the period.
Net fees from player sales were £90.6m, with actual receipts of £10.0m implying a significant increase to transfer receivables over the period as well.
For the receivables portion, given the timing of two significant sales (Minteh; Anderson), it is possible a meaningful portion of the spread reflects a short-term timing difference from sale (very end of financial period) to receipt of cash (early in 2024/25).
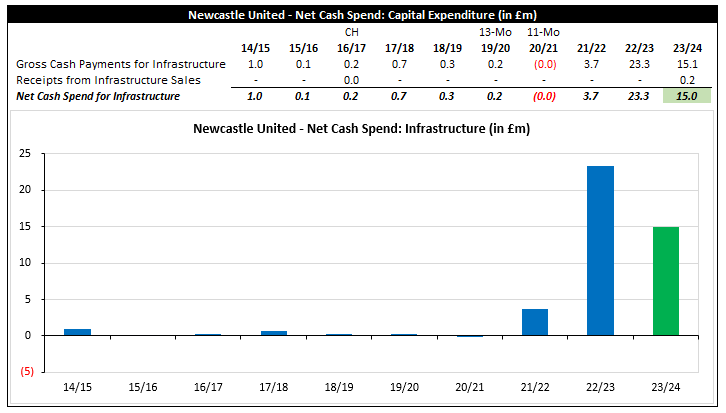
NUFC’s net capex for 2023/24 of £15.0m is driven by development of the St. James’ STACK fan zone, improvements to hospitality lounges at the stadium, and upgrades to the first team training ground.
Net capex from the Oct ’21 takeover to end-Jun ’24 totaled £42.0m, which is in stark contrast to the de minimis capital investment spend under Mike Ashley.
That contrast is primed to become even starker in the years to come, with the club intent to (i) expand stadium capacity through redevelopment of St. James Park or (seemingly more likely) construction of a new stadium and (ii) build a new training ground.
The cash deficit from CFO + CFI of £94.1m takes the 2021-2024 cumulatively deficit to £330.9m, reflecting cash generated from operations of £16.4m versus net cash fixed asset investment of £347.3m (player: £305.3m; capex: £42.0m).
Cash Flow from Financing (CFF)
The cumulative CFO + CFI deficit of £330.9m across 2021-2024 plus loan repayments of £22.5m in 2021/22 prior to the Oct ’21 takeover (£17.5m deposit from consortium to MA was applied to owner loans; £5.0m term loan repayment) across 2021-2024 was effectively met through £302.9m in cash-for-equity injections from new ownership and a £50.0m term loan provided by HSBC.
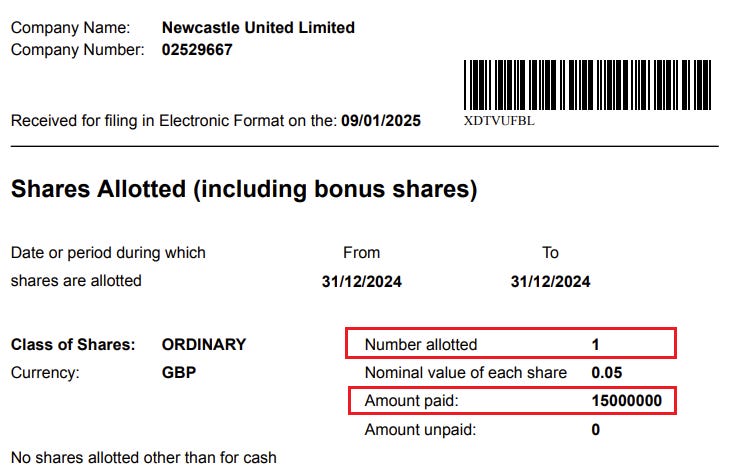
With respect to owner funding, further capital injections of £50.0m were provided in 1H 2024/25 (Oct ’24: £35.0m; Dec ’24: £15.0m), taking total post-takeover owner funding to date to £352.9m.
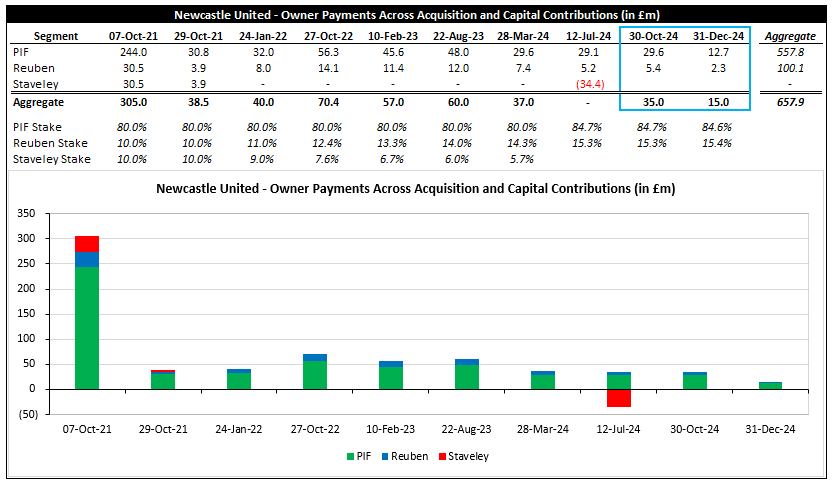
As an aside, while the note for subsequent events cites owner funding of £13.5m in Dec ’24, I have opted to use £15.0m in the preceding figure and associated commentary in alignment with the share allotment form filed to Companies House.
Section 4 – Debt Measures
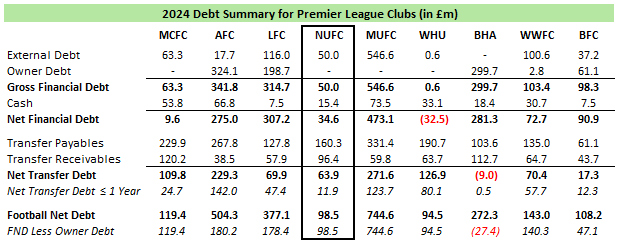
This section discusses (i) financial debt, (ii) transfer debt, and (iii) and football net debt.
Financial Debt
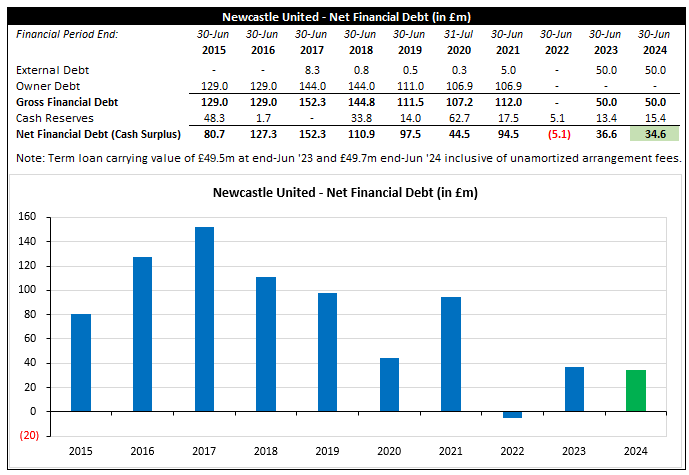
Newcastle’s net financial debt decreased by £2.0m to (a very modest) £34.6m, reflecting the £2.0m increase in cash versus no movement in gross financial debt, which is comprised of a £50.0m secured term loan from HSBC that is repayable in Jul ’25 and bears interest at SONIA + 2.9%.
Additional notes with respect to financial debt:
NUFC also has a £25.0m revolving credit facility (RCF) from HSBC that (i) also matures in Jul ’25 and (ii) has been fully cleaned down at each financial year end since facility origination.
The club disclosed in accounts that negotiations are in progress to extend the term loan for a further 4-year term. While there was no explicit reference to potential extension of the RCF, that facility may also be part of discussions.
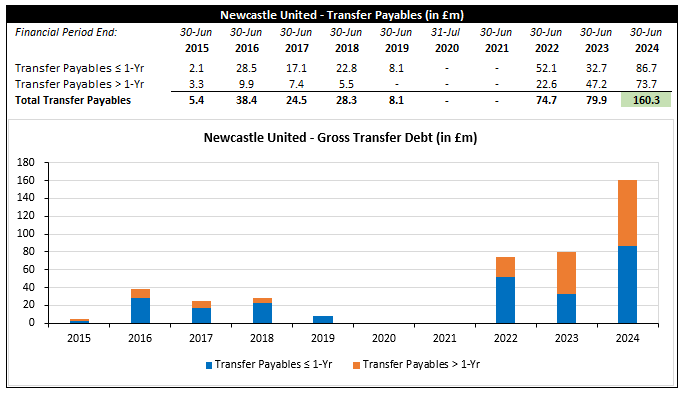
Transfer Debt
Newcastle’s gross transfer debt more than doubled from £79.9 to a club record £160.3m (+£80.4m), with transfer payables due within 1 year climbing by £54.0m to £86.7m (also a club record).
The sizeable increase fits with the observation in Section 3 that gross cash player spend was notably less than gross spend by cost during the period.
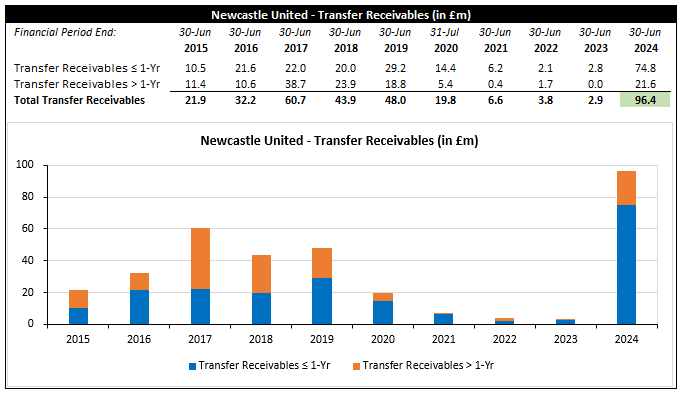
Also fitting with expectations cited in Section 3 based on the observation that net sales significantly exceeding cash receipts during the period, transfer receivables increased by £93.5m to a club record £96.4m, with the portion receivable with 1 year increasing by £71.9m to £74.8m.
As a supplemental note, included in transfer receivables of £96.4m are £14.3m due from Saudi Pro League club Al-Ahli (75% owned by PIF) stemming from the transfer of Allan Saint-Maximin.
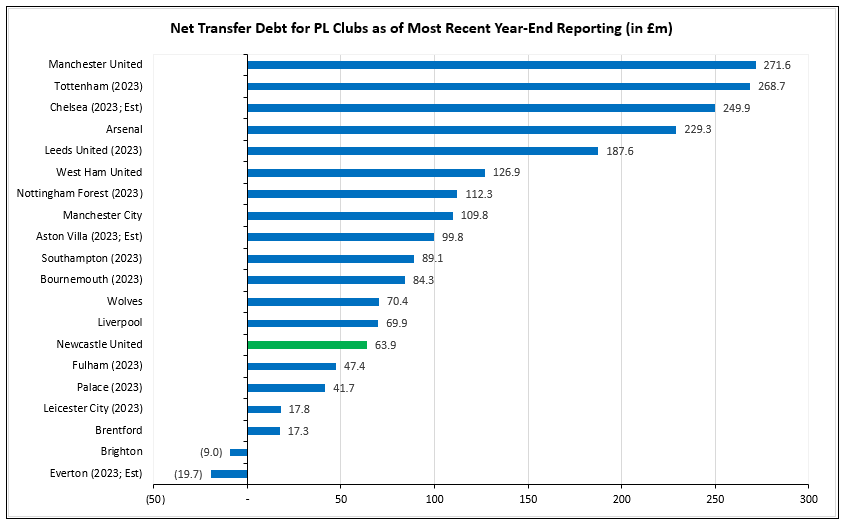
Based on the £93.5m increase in transfer receivables versus £80.4m increase in transfer payables, the club’s net transfer debt decreased by £13.1m to £63.9m (note: current portion decreased by £18.0m to £11.9m).

Newcastle’s net transfer debt at end-2023/24 is 7th among the 9 PL clubs to publish results to date and 14th highest across the division based on latest annual reported figures, demonstrating the club’s comparatively modest reliance on net transfer debt to facilitate player investment.
Football Net Debt
Football net debt (FND) is an industry-specific figure that aggregates net financial debt and net transfer debt to provide a more complete view of debt obligations of football clubs.
Football net debt (FND) is an industry-specific figure that aggregates net financial debt and net transfer debt to provide a more complete view of debt obligations of football clubs.
Aggregating the component figures for NUFC results in football net debt of £98.5m, representing a £15.1m (13.3%) YOY increase (net financial debt: -£2.0m; net transfer debt: -£13.1m).
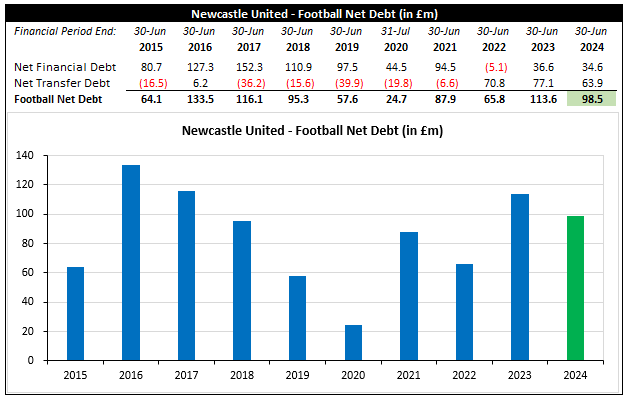
NUFC’s FND of £98.5m at end-Jun ’24 is the second-lowest year-end figure among the 9 PL clubs to publish full 2023/24 financials thus far, reflecting the positive impact from equity funding in keeping FND modest despite sizeable investment vis-à-vis modest organic cash flow across 2021-2024.
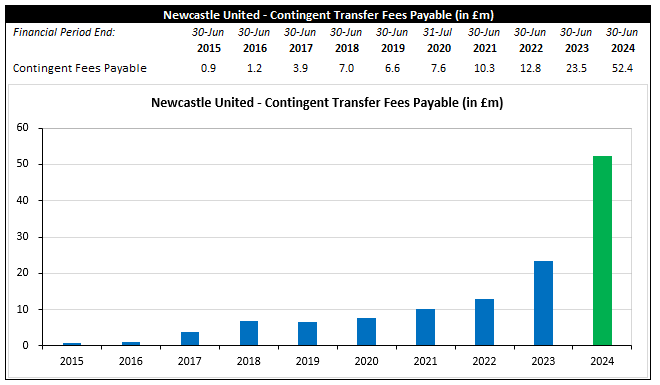
Contingent Transfer Obligations
With respect to potential transfer obligations, NUFC’s gross unmet add-ons more than doubled from £23.5m at end-Jun ’23 to £52.4m at end ‘Jun 24. However, given the club’s low FND and capacity of ownership to supply further funding if needed (among other considerations), the potential crystallization of these contingent payables is not an issue for the club.
Conclusion
Newcastle’s 2023/24 financial period saw key financial metrics correlated with greater on-pitch success – such as revenue, wages, and squad cost – converge towards those of Big 6 clubs.
However, a meaningful gap for those metrics remained as of end-2023/24, with the tangible impact of PL PSR regulations serving as a key obstacle to closing the gap as promptly as the club would like.
One key near-term outlet to maintain robust growth while remaining in step with financial regulations is qualification for the 2025/26 UEFA Champions League. It won’t be easy to attain with the club currently sitting outside the top 5 and several other clubs positioned similarly in the table, but a spot in the financial lucrative competition is there for the taking with a strong finish to the season.